
Inflation, Stagflation, When Elation?
Inflation, Stagflation, When Elation?
Macro Deep Dive with a Bitcoin Update

Hey guys,
I hope you all are well and enjoying summer. In this newsletter I’m going to go over the macro once more, with a focus on inflation, stagflation, and which assets tend to perform best in a stagflationary environment.
I hope you all haven’t missed me too much. Work has been busier, and it’s definitely harder to find time to write when the sun is shining and friends are home from uni. The deadline this time was not Glastonbury, but Boomtown. Tickets from 2019 have rolled over into today, so as a very different person to 3 years ago, I shall be disappearing into a field again.
I know a few friends only read this first section for the entertainment, so the following is for you:
Last month at The Do Lectures, I met a guy who was telling me how some parents force random knowledge on their kids to make them sound clever. Random long theorems and laws that the kids couldn’t possibly understand. He didn’t see the point in it all and said there was clearly no use to this knowledge. He then continued to tell me about his 11-year-old kid, let’s just call him Rob, who genuinely knew 100 digits of Pi... 👀Yep ik, but apparently this was all Rob’s doing as he just loved numbers.
During year 7 maths, the class was asked if anyone knew what Pi was. Little Rob put his hand up and then continued to recite 100 digits Pi, like the absolute don that he is. The teacher obviously thought he was playing a year 7 prank. They pulled up the digits of Pi on the whiteboard and told poor little Rob to get up in front of the class, facing away from the whiteboard, and recite Pi once more. Naturally, Rob delivered the goods. The teacher was so blown away, that she took Rob to another class, told the teacher to get up Pi on the whiteboard, and asked Rob to once more walk the path he was destined follow. Rob did it again. The teacher then repeated this in EVERY single class in the school. Rob was no longer Rob. From that day on, he was known as Pi-Kid. Pure epicness. I just love that there is a kid out there who re-lived that moment from ‘The Life of Pi’.
Anyway, enough stories. Time for the goods.
If you find this newsletter of value and wish to share it with friends, go crazy on this button:
And if you wish to subscribe, please do so here:
The Risk of Stagflation
As the Fed continues to tighten (raise interest rates and perform quantitative tightening), the question on everyone’s mind is ‘wen Fed pivot?’
Following the latest FOMC press conference, the markets have been pumping as Jerome Powell (head of the Federal Reserve) said they will no longer be stating their future plans for interest rate hikes at future meetings, and instead be adopting a more meeting-by-meeting approach. The markets have interpreted this and the overall press conference, to mean that a pivot could occur sooner, hence the recent pump.
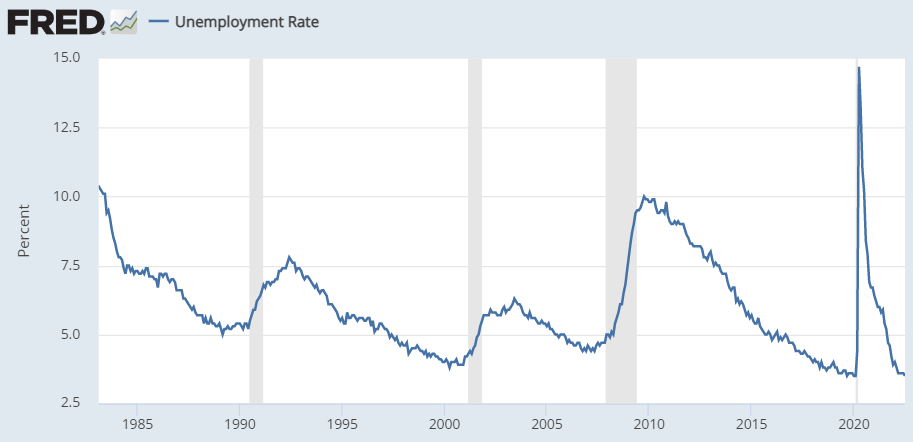
But we shouldn’t be jumping the gun to soon. The Fed have said they are going to be more data dependent and the two key pieces of data they are following is the CPI (inflation) and unemployment. The latest CPI made another high hitting 9.1% and unemployment rate is still at record lows.
So, for this week’s newsletter I’m going to dive further into the current inflation dynamics and then look at some of the assets which perform best in these types of environments.
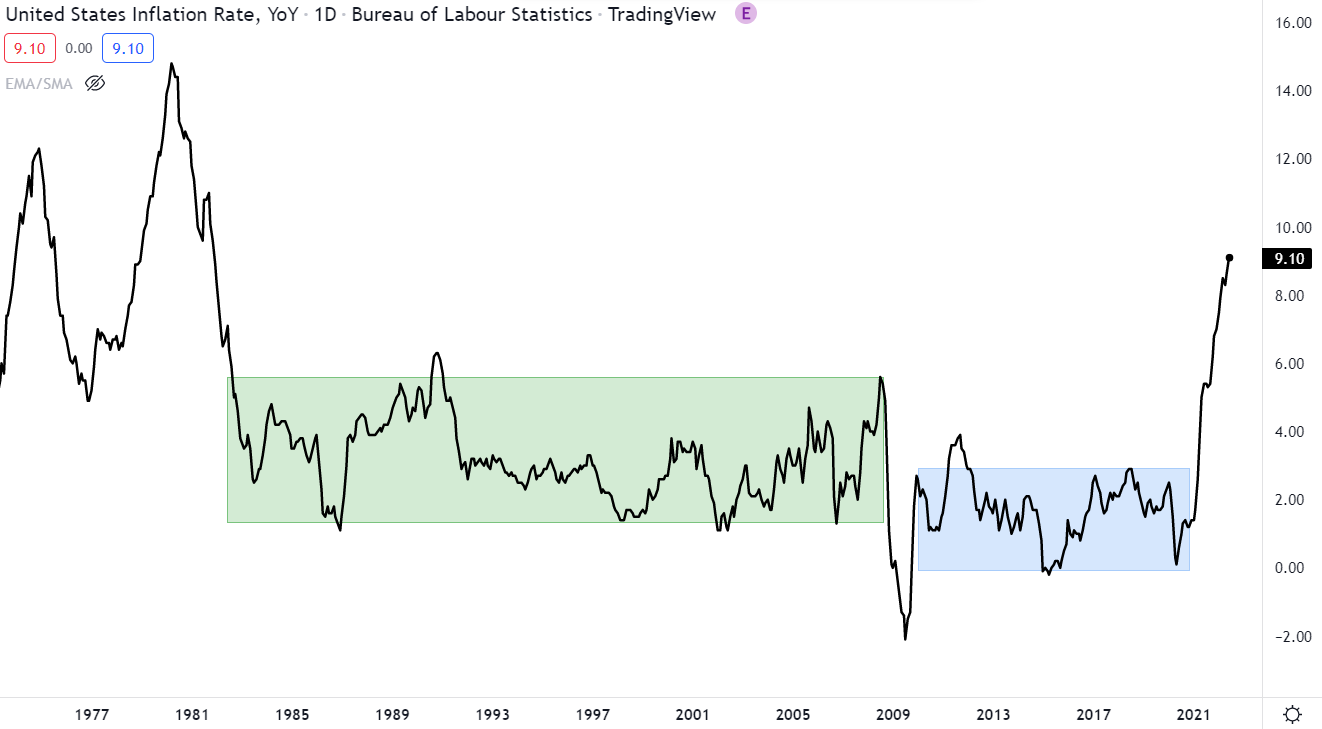
Since the Great Financial Crisis in 2008, we have been living in a very low inflation environment (blue box below). In a system built upon credit and debt, deflation is the last thing central banks want, so they have been heavily stimulating the economy through quantitative easing and very low interest rates.
The low-inflation era can be simplified down to 4 key pillars:
Cheap immigrant labour keeping service sector wages stagnant in Western countries, cheap goods from China raising living standards despite stagnant wages, cheap Russian gas powering German industry and the EU, and general high supply of commodities.
So, what’s changed?
Nativism, pandemic, protectionism, geopolitics and climate change.
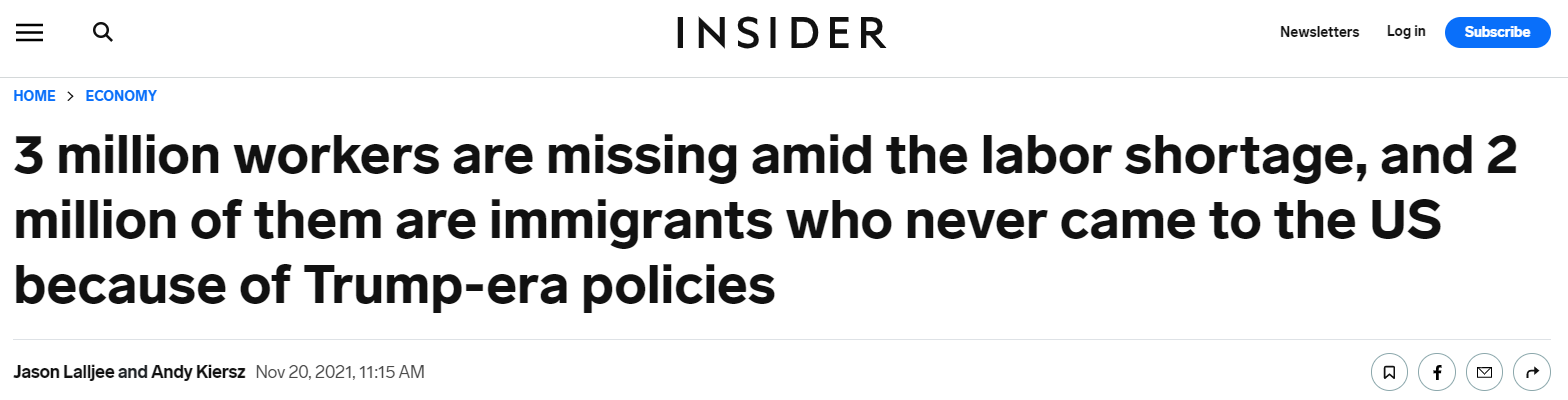
President Trump’s immigration policies to appease nativists has cost the U.S. two million jobs. Brexit is having a similar effect in the UK.
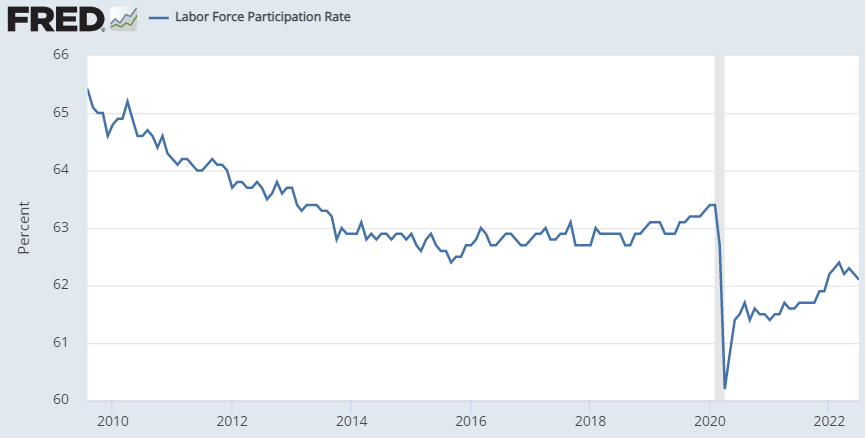
Covid-19 has also changed labour markets as people retired early and many workers that were fired have not returned to their jobs. This can be seen by the significantly lower labour force participation rate.
After extreme wealth gains from all markets (such as housing, crypto and stocks), covid government paychecks and a change in lifestyle, many people feel rich, want to work less, and want to spend more. You have more people wanting to spend, with less people wanting to produce the goods that people want to buy. Inflation.
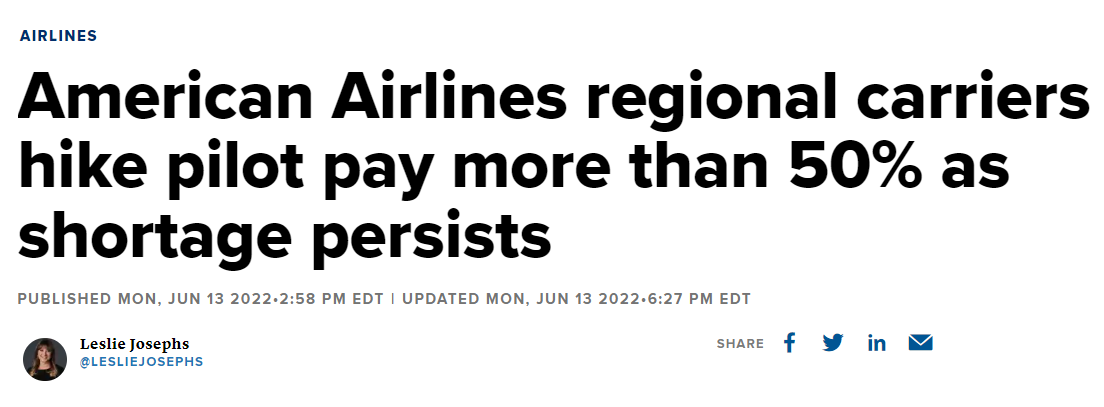
The airline industry for instance let go of millions of workers and are now struggling with mass staff shortages, and pilots that retired early are being offered 50% over the salary of active pilots to come back to work.
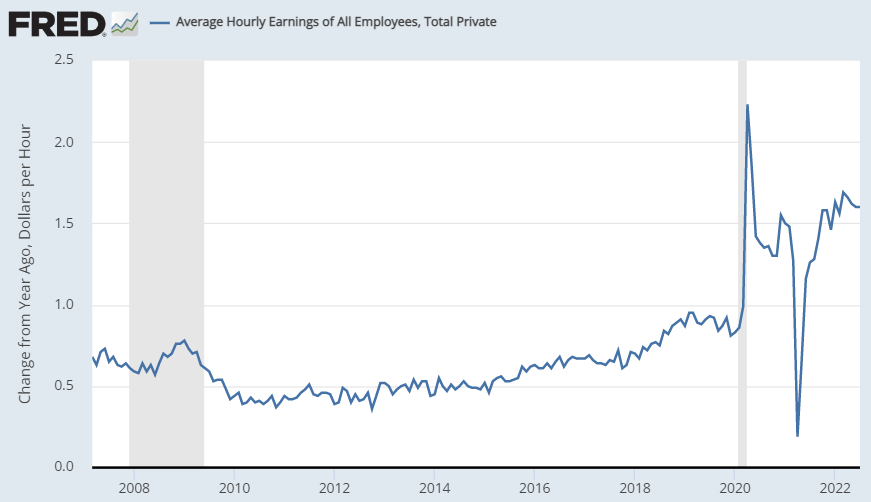
This whole dynamic is leading to a rise in average hourly earnings, albeit not as fast as inflation, so workers are still suffering. With the costs of living continuing to rise, workers continue to go on strike to demand higher wages, and this will likely continue, adding to the inflationary fire, until unemployment significantly picks up.
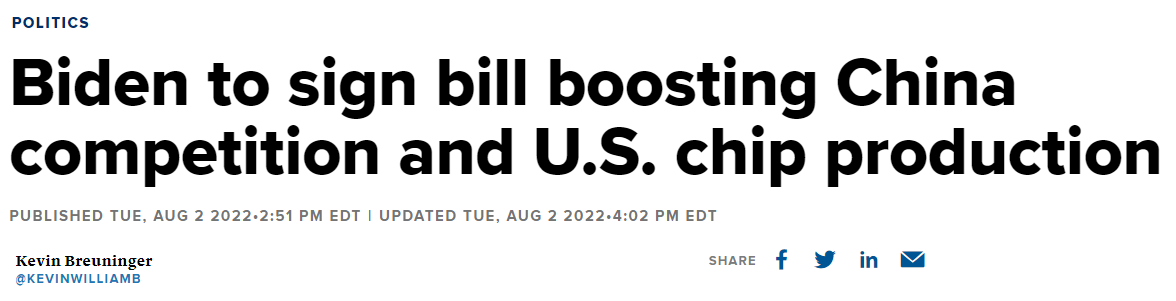
As for cheap China goods, Trump’s hard-line approach to China became a bipartisan stance that has resulted in tariffs on cheap goods and has escalated into more of a technology war. For instance, it’s been reported that ASML, the number one company that manufactures lithography systems (machines vital for chipmakers), is to be restricted from selling equipment to China. As I discussed in the last newsletter, the industrial industry in the US has been completely hollowed out over the last few decades as more and more manufacturing has been offshored to the east. As a matter of national security, the US is realising that in order to compete with China, they can’t rely on China to make everything for them.
China’s zero covid policies have also created a series of cardiac arrests in global supply chains, disrupting the flow of cheap goods to the west.
Where in past decades the trade and economic relations between the US and China have been deflationary, it now seems the tides are turning to become more inflationary.
I think we know how the story of Russia and its natural gas is going. However, what I did not previously know is that President Putin had been selling natural gas to Europe usually cheaper than alternatives to tip the balance of economic power in his favour and away from the US. In retaliation the US, sanctioned Nord Stream 2 last November. Nord stream 2 allowed Russian gas to flow directly to Germany from Russia and faced backflash from parts of the EU and US as it would increase Europe’s reliance on Russian natural gas, which already accounted for 45% of their imports and almost 40% of its total gas consumption in 2021. Part of Germany’s issue has been their nonsensical desire to phase out all nuclear energy, which has led them to rely more and more on Russian gas.
Then as President Putin’s frustration with the shifting balance of military power in Europe (NATO) spilled over into a hot war in Ukraine on February 24th, the economic war was taken to another level. The US weaponized the US dollar by essentially saying, ‘dollars are worth nothing if we don’t like you’, and Russia weaponized commodities.
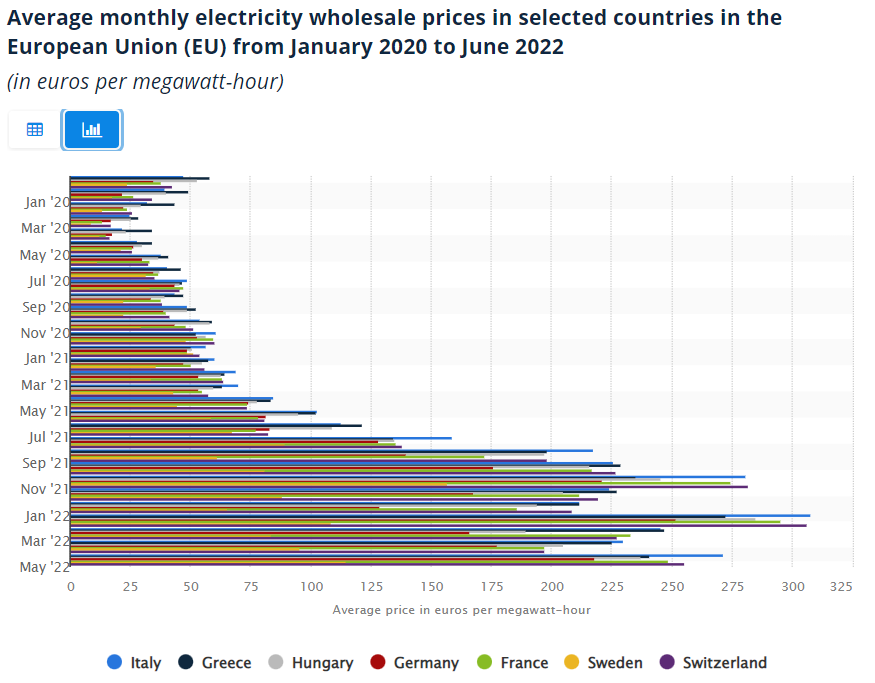
Since the war, the EU is doing its best to phase out Russian gas from its Energy equation but replacing 40% of your total gas consumption in a few months is no easy task. EU electricity prices have more than quadrupled in Germany. Naturally, this is quite inflationary…
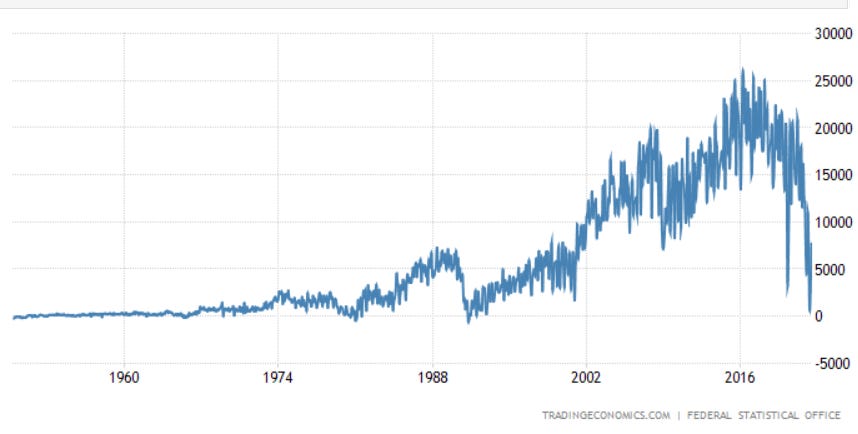
This has also led to Germany’s balance of trade falling off a cliff. A country who has historically had a large trade surplus - value of total exports greater than imports - is now struggling to maintain its trade surplus due to energy costs.
Although a big proponent of the current shortage of commodities is due to Russia’s weaponization of them, especially in Europe, it is also due to the commodity cycle. The last commodities super cycle was from 2002 until around 2014. This led to a huge build out in infrastructure and an era of cheap commodities. This can be seen in the prices of copper and oil below.

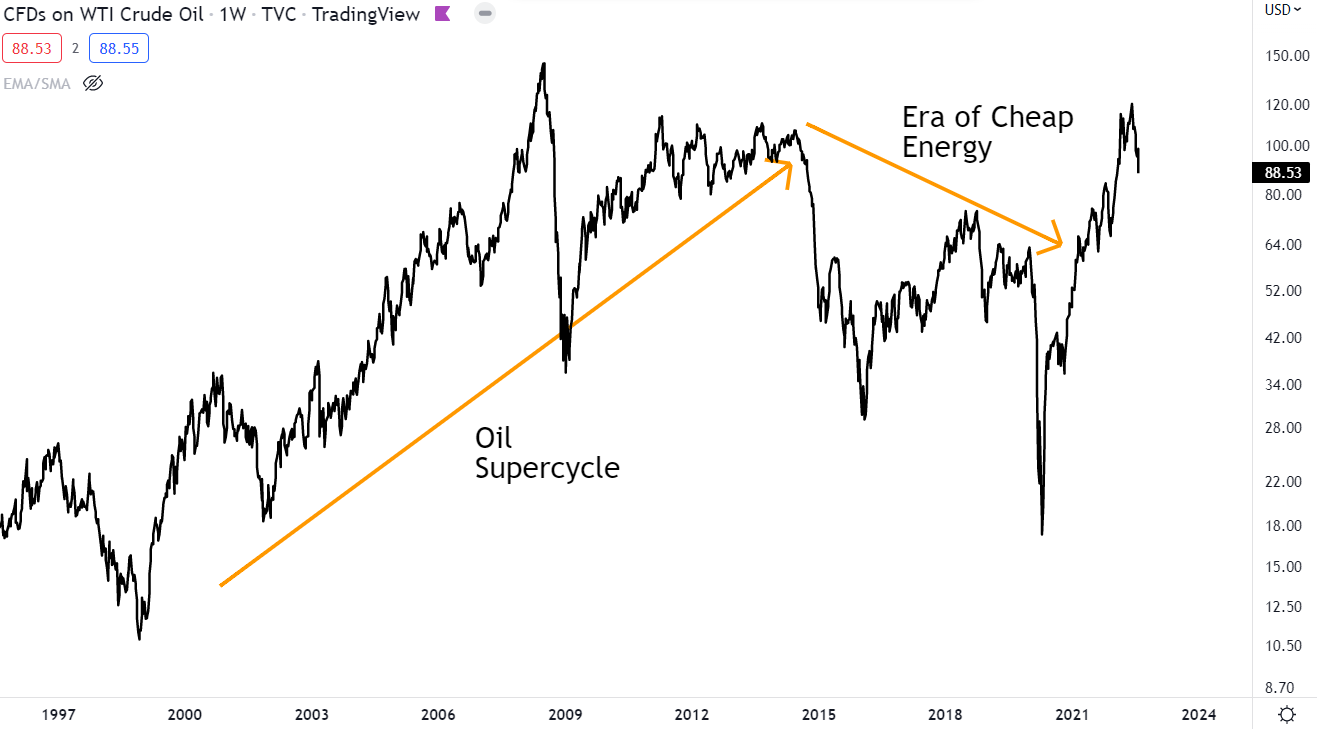
The result of cheap commodities is lower profits for commodity producers. Lower profits scare off investor money. Less investor money + lower profits = less infrastructure buildout. After a long enough period of little to no infrastructure buildout, supply starts to get very tight relative to demand, and the structural backdrop for a new commodity supercycle is born.
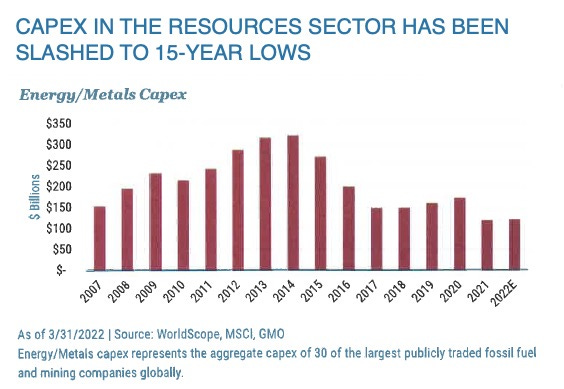
Here we can see CapEx (capital expenditures - funds used by a company to acquire, upgrade, and maintain physical assets such as property, plants, buildings, technology) in the resources sector. Since 2014, this has been in a steady downtrend, whilst the demand has been in an uptrend.
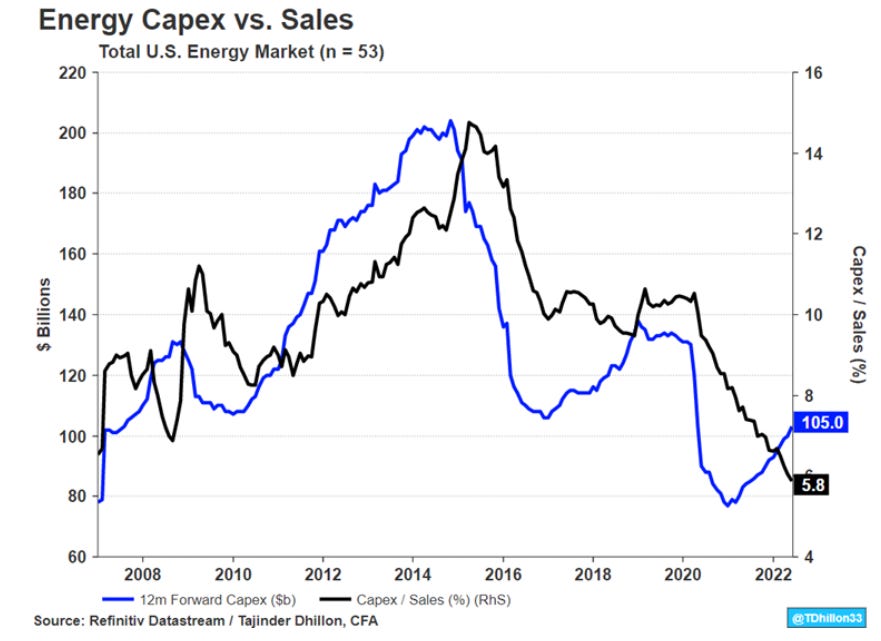
The area to suffer the most in this era were fossil fuel companies. With the rise of climate change awareness, the oil sector in particular has become particularly hated. However, they simply produce the stuff because we use it. If we keep ‘hating them’ but keep increasing our use of their stuff globally, this inevitably leads to higher oil prices.
Oil companies are currently being asked to use profits to build new infrastructure to boost production, but at the same time are being told they are going to be phased out in the next few years. Without clear guidance and regulation, it’s unlikely new infrastructure will be built, so the oil market remains very tight.
We have a backdrop of tight commodity markets in a world of economic war. The deflationary pillars of the last decade seem to be crumbling. Where the old job of the central bank was to inflate asset prices through quantitative easing (QE) to fight deflation, they are now adapting to fighting inflation by deflating asset prices vis a vis higher interest rates and quantitative tightening (QT). But how much control do central banks really have and can they contain this inflation?
“Welcome to the war economy… …where heads of state matter more than heads of central banks.” - Zoltan Psozar
Lack of immigrant labour, fewer cheap China goods, Russian weaponizing commodities and a general lack of commodities are not things the Central Bank can control.
All of these are supply side issues. They cannot change immigration laws or build new energy infrastructure. However, they can bring down demand by inducing a recession, through tightening monetary policy. Current fears of a recession have brought down prices of commodities somewhat, but other areas of the CPI, like rent, continue to rise so CPI is yet to fall. The labour market also remains fairly tight, so we are likely in for more pain, as the Fed continues tightening.
The risk here is stagflation - high inflation during a period of slow growth.
“The market can talk all it wants about a “soft landing,” but as explained above, we need an “L” -shaped adjustment in activity, and an “L” -shape has two parts: first an “I” which you can think of as a vertical drop (perhaps a deep recession); second, an “_” which you can think of as a flatline (stagnation, as in stagflation).” - Zoltan Psozar
This is a chart from Bridgewater Associates. It shows leading stagflationary pressures vs what is discounted (what the markets are pricing in).
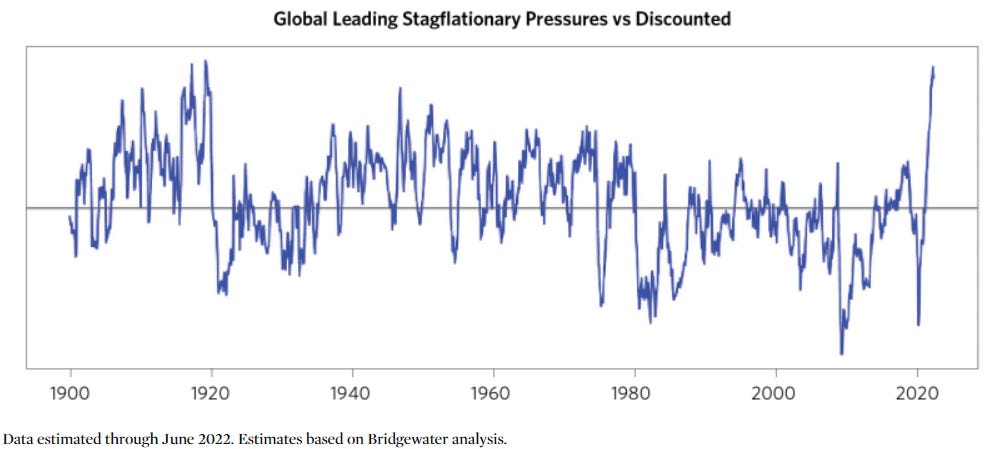
“Today, our indicators suggest an imminent and significant weakening of real growth and a persistently high level of inflation (with some near-term slowing from a very high level). Combining this with what is discounted, the difference between what is likely to transpire in the near term and what is discounted is the strongest near-term stagflationary signal in 100 years.” - Bridgewater Associates
They see inflation slowing a touch in the short term, but they can’t imagine policy makers will be able to tolerate the level of economic weakness required to bring down inflation for long, so they will eventually have to pause or reverse course. This will reignite inflation, causing stagflation to remain for longer, as the Fed will be forced into at least a second tightening cycle, to achieve the desired level of inflation, much like in the 70s.
Inflation (black), Interest Rates (orange)
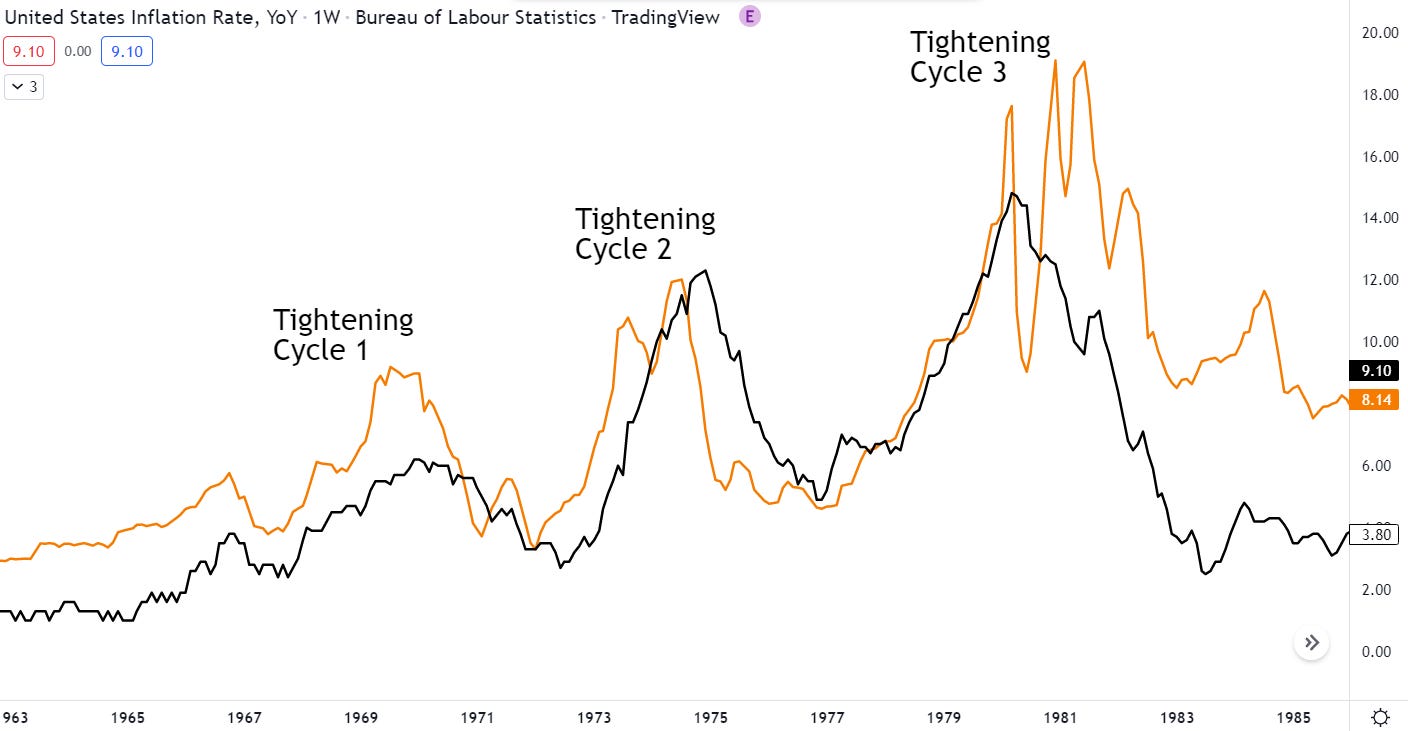
“A second tightening cycle is not discounted at all and presents the greatest risk of massive wealth destruction.” - Bridgewater Associates
So, how the hell does one navigate all this? This is a question I have been asking myself, and I think a good place to start is in knowing how different asset classes perform in these periods.
Below you can see how a range of assets perform during stagflation vs other periods.
Sharpe ratio is the return in excess of the risk-free rate (10-year Treasury bond yield) per unit of volatility. Essentially the return relative to volatility and what you can get risk free (holding a treasury bond). The higher, the better.
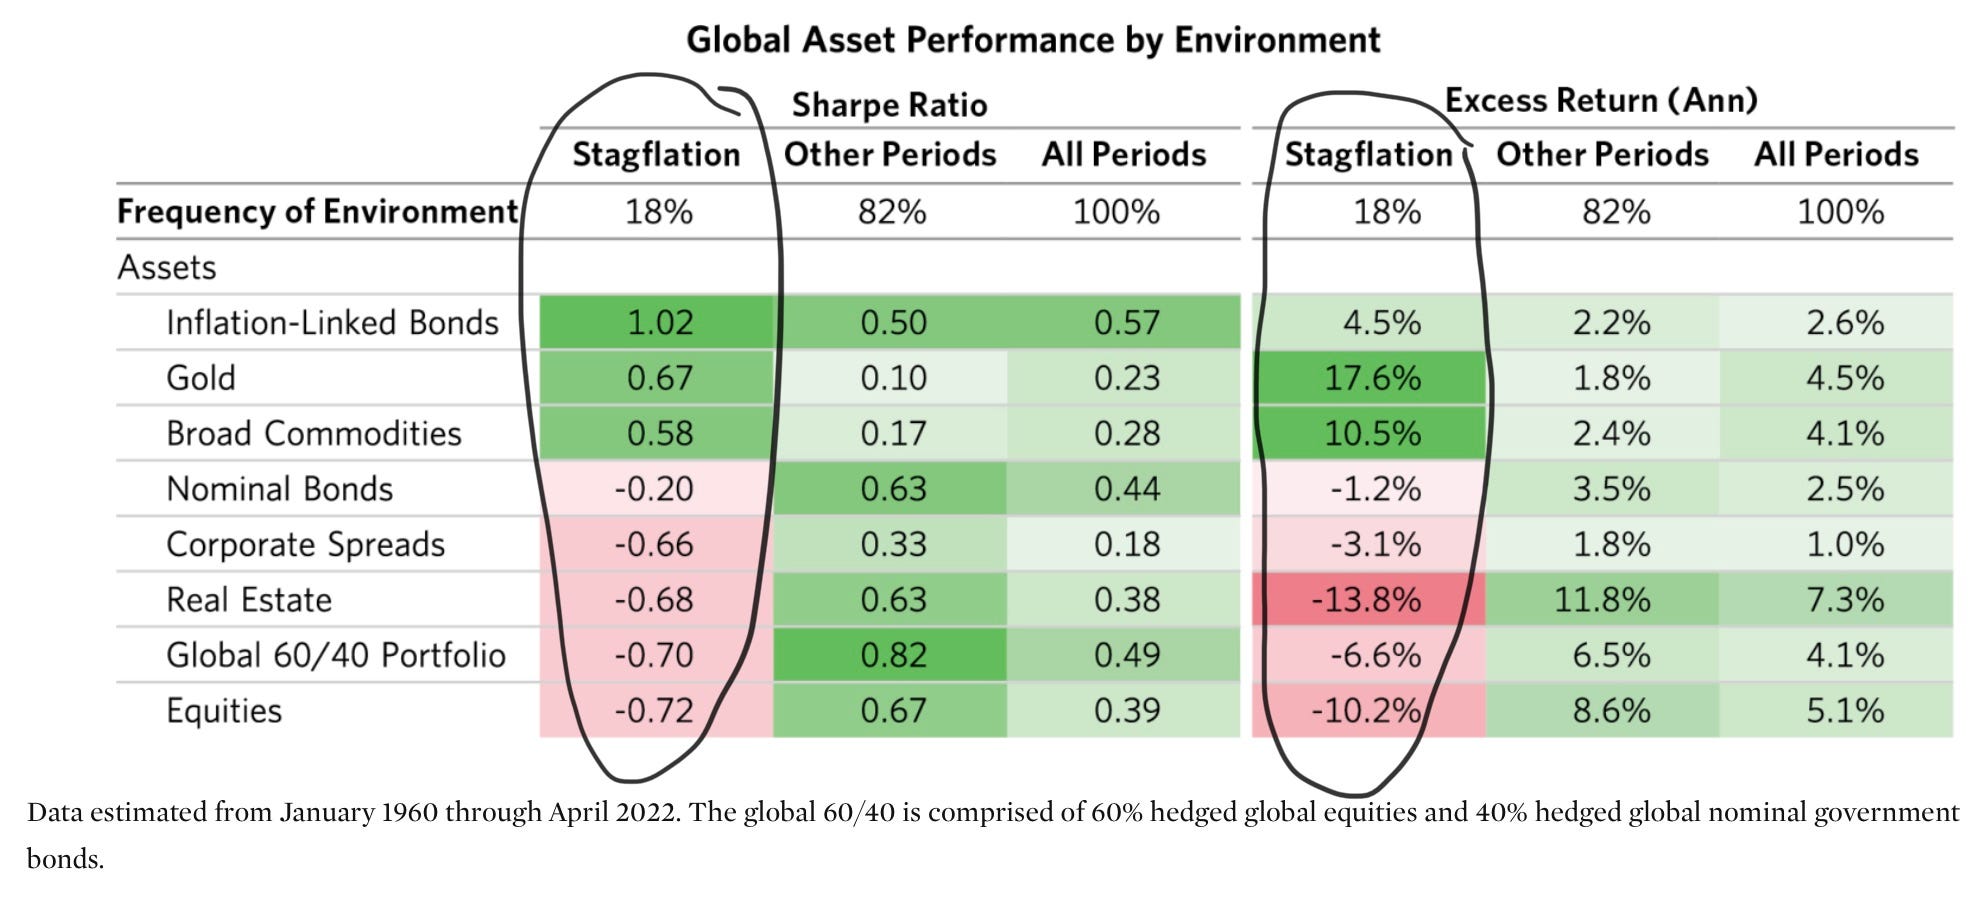
This shows us that the least volatile asset with positive returns were the inflation linked bonds. The best performing assets were gold and broad commodities, and the worst were equities and real estate. Equities and real estate are both tied to the state of the economy, therefore they perform poorly during stagflation, as the economy is struggling. However, we need to dive a bit deeper. During stagflation, the Fed can be in two different modes: tightening or stimulating. When the fed is tightening it drives risk premiums and discount rates up, causing asset prices to fall. (Say the 10-year Treasury bond has gone from 1 to 3%, the risk-free return you could get from just buying this bond has increased by 2%. Therefore, if you are going to take more risk by buying a riskier asset like a stock, you will want it to return 2% more than it did before, which requires lower asset prices to give you those extra returns.) When the Fed is stimulating to support growth, this drives risk premiums and discount rates down, so assets tend to do well for some period of time despite the stagflationary environment.
Here we can see the chart for both of these scenarios.
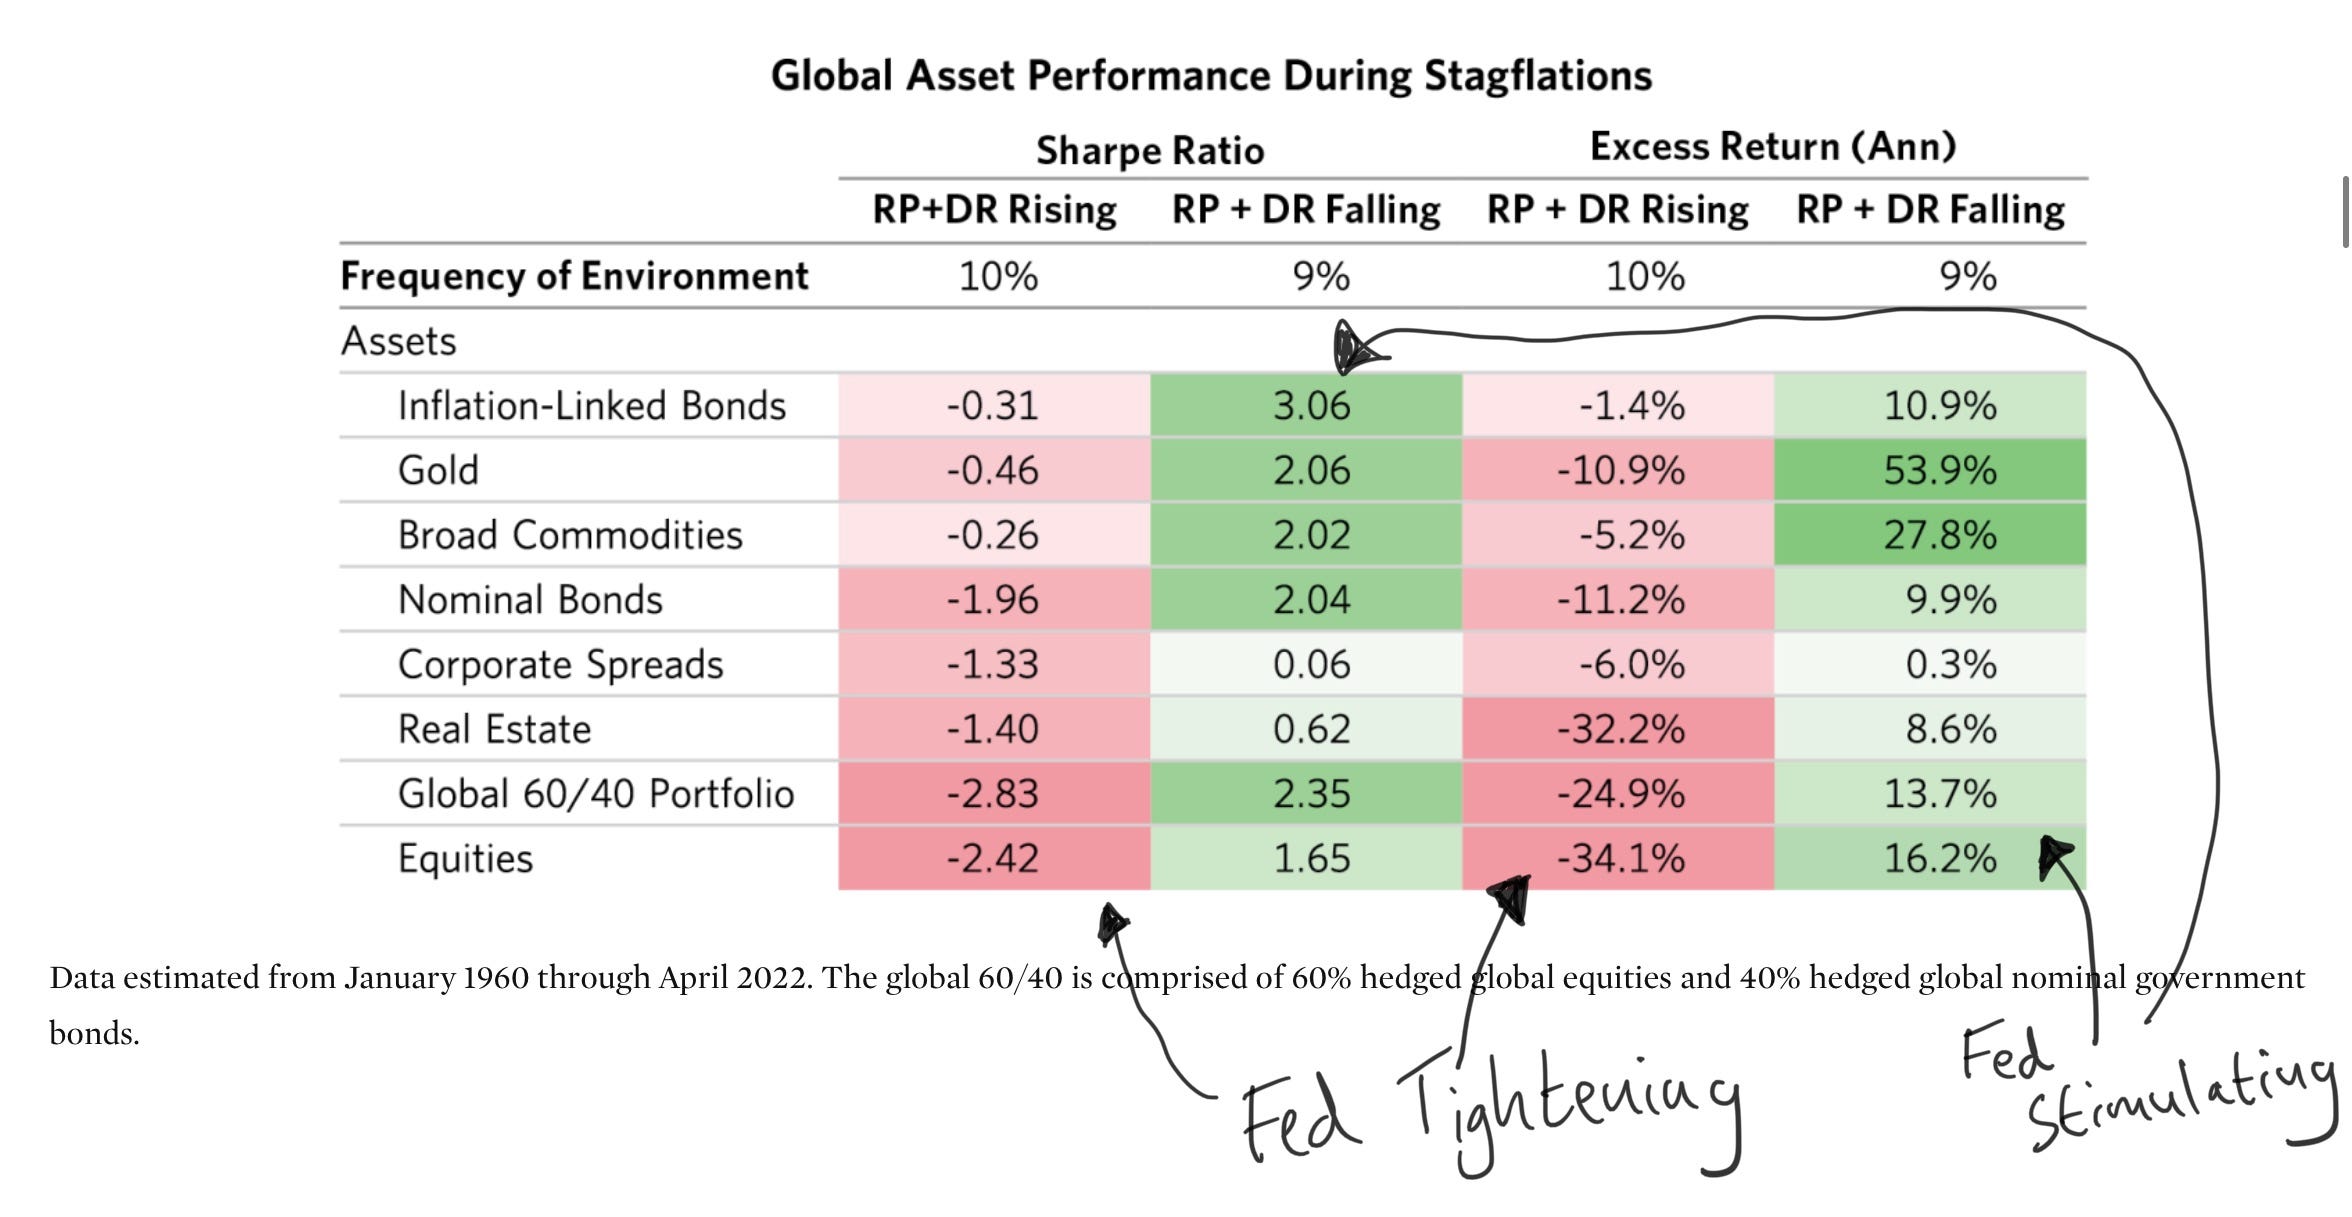
The rankings are similar to the first chart, but the returns are drastically different. During stagflation and tightening monetary policy, all assets perform poorly, so paradoxically, despite the high inflation eroding away your buying power, holding cash is actually the best option during this period. However, once the Fed pivots, cash is once more trash, and all assets perform well, especially gold and commodities.
I think they key takeaway here is that when the Fed is tightening, the economy is slowing, and inflation is high, cash really is king, but that gold and commodities should not be ignored especially when the Fed pivots. Diversification is key. Different assets perform well in different environments and if you hold a good mix, you can be prepared for multiple scenarios.
One asset class that is not included in this study is Bitcoin. The simple reason being that it has never been around for a period of stagflation.
Bitcoin (and Gold) Does Not Hedge Inflation
There is a common belief that gold or Bitcoin hedge inflation. Hence, when the CPI starts rising, as it has been recently, and Bitcoin performs poorly, everyone is like “HA! See?? Bitcoin doesn’t hedge inflation.” But the notion that Bitcoin, or gold, hedge headline inflation doesn’t make any sense. The CPI is made up of everyday things you spend money on; rent, food, energy, transport, medical care etc.
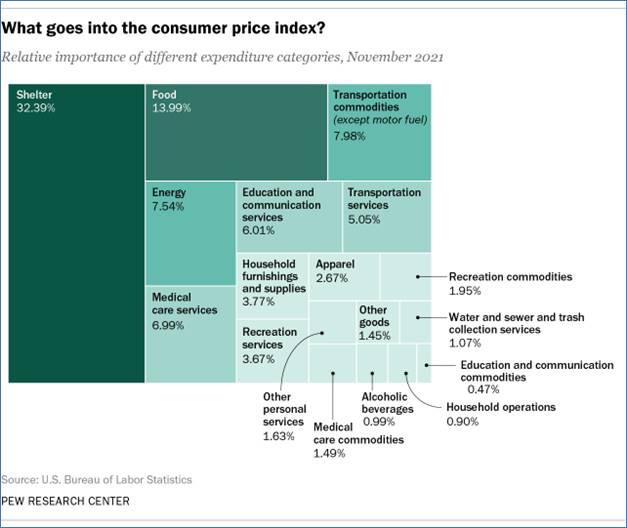
Why would the price of Bitcoin increase at the same time as rent or food? They are in completely different categories. The same for gold. If the cost of your rent and food starts going up, do you go out and buy gold? If you want a real inflation hedge, you buy something in the CPI, i.e. Oil.
So, where does the confusion come from?
Debasement of Money.
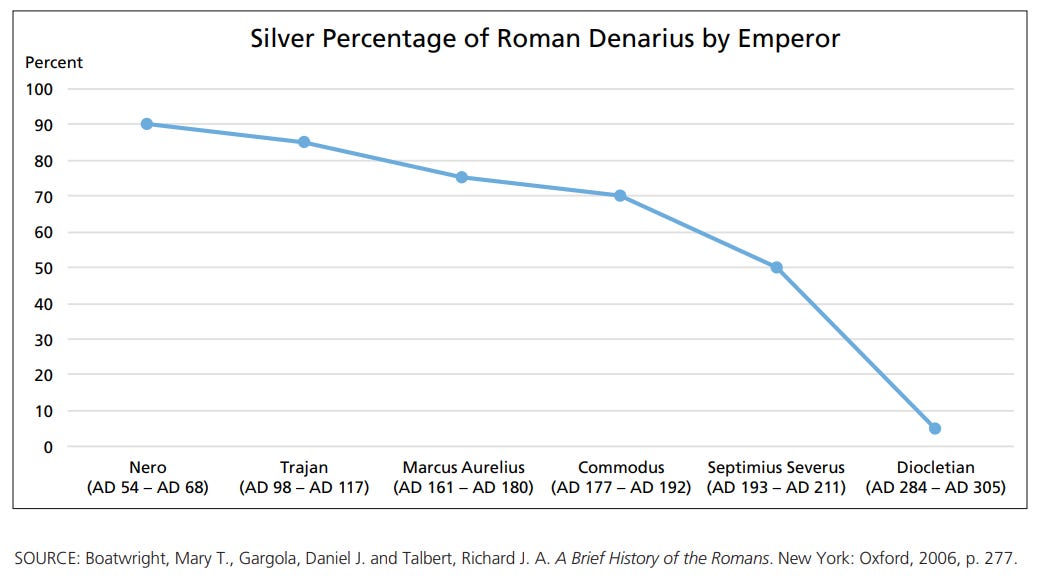
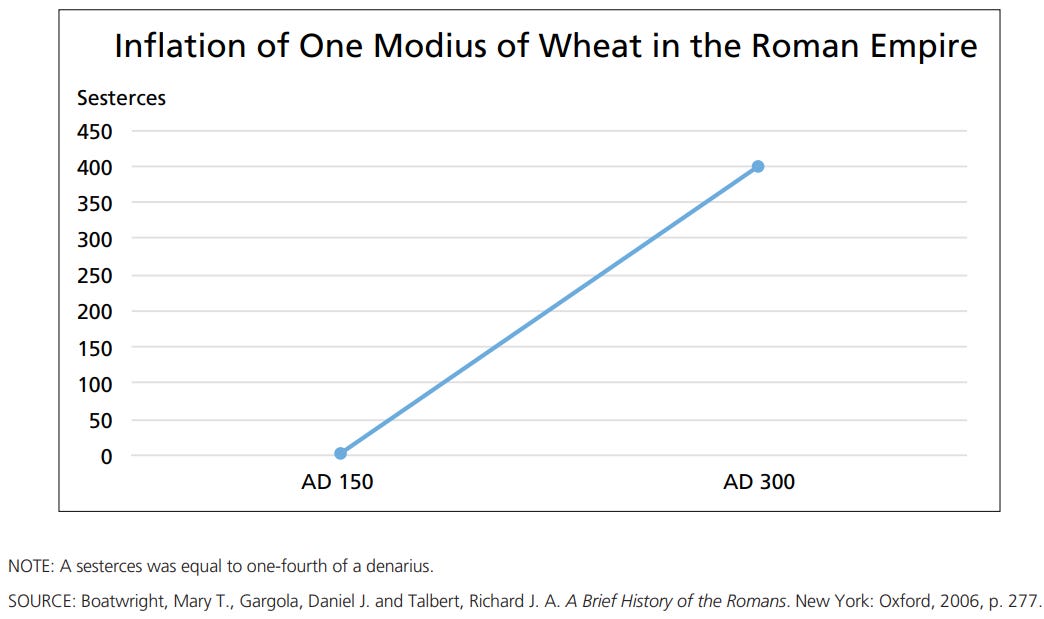
The word debasement comes the Roman times when they would ‘print money’ by mixing base metals, usually copper, into precious metal coins. This happened at an increasing rate and was one of the factors in the fall of the Roman Empire.
The way in which you could protect yourself against the debasement of money would be to hold gold or silver. The same is true today. So long as the general sentiment that gold is something of value remains intact, the increase in dollars in a system will inevitably lead to a rise in the value of gold. This is especially the case if people start doubting the stability and value of their own currency and start looking for alternatives. During periods of instability, like war, people also look to buy gold as it is considered a safe haven asset. It is apolitical, governments cannot print more of it to fund their wars, therefore it will have value no matter the outcome of a conflict.
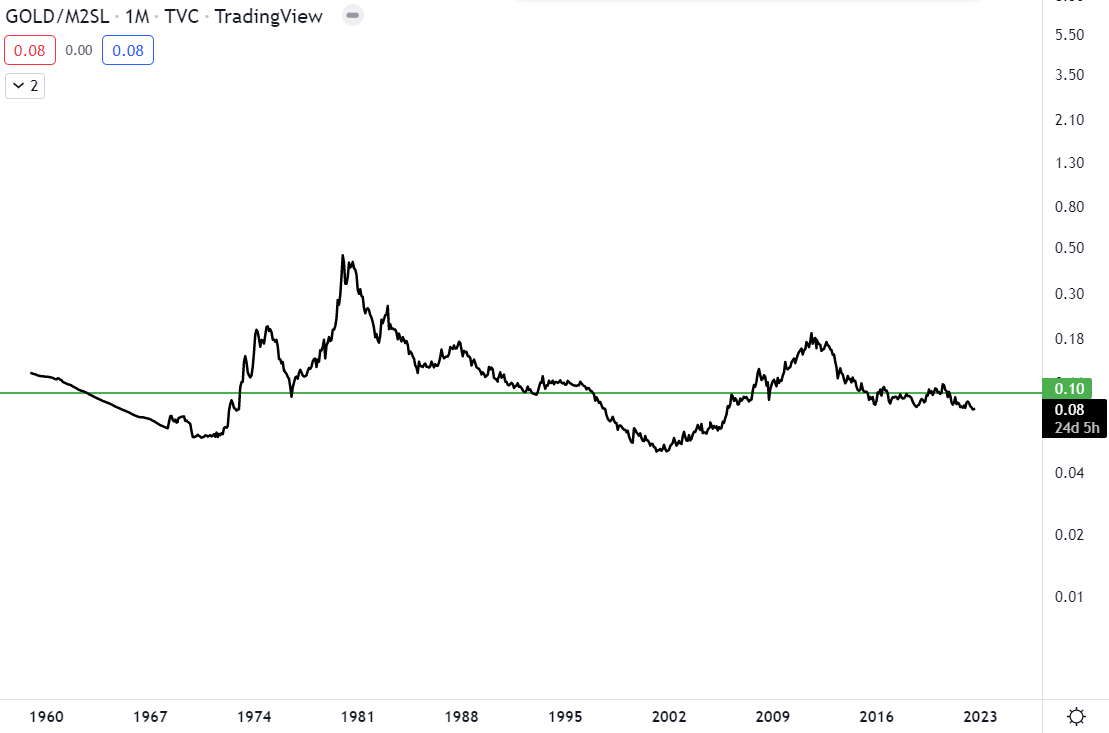
We can see the relationship between the debasement of money and gold by comparing the gold price to the M2 Money Stock. The M2 includes cash, checking deposits, and easily-convertible near money. It is a good measure of the broad money supply in the US.
M2 (Black), Gold (Blue)
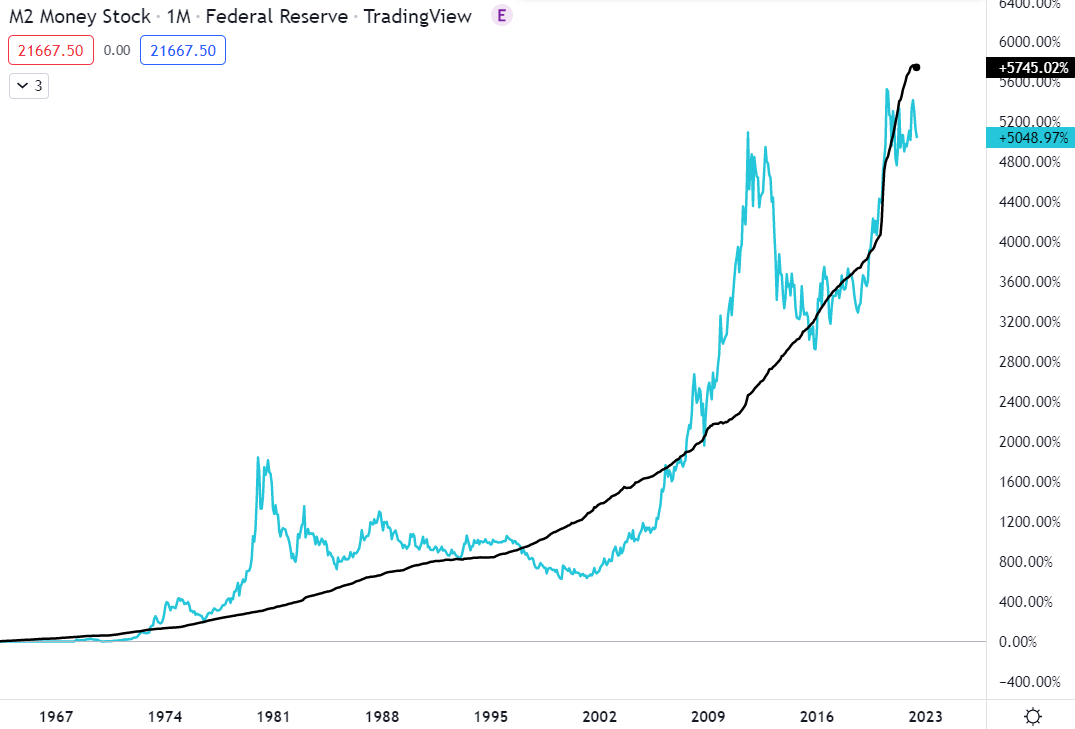
This trend is clear, but it is a pretty rough chart, so I’ve divided gold by M2 to create a clearer image of this relationship. Although there are some fluctuations, in general it oscillates around the same level and has gone sideways for the last 50 years. If the board money supply increases, so does the value of gold and vice versa (although there are only very short periods of time in which the broad money supply actually goes down/sideways) - prooving that gold will protect against the printing of money.
Bitcoin is much the same. Although they are very different in their mechanics - gold is a nice shiny rock, Bitcoin is a bunch of 0s and 1s on a lot of computers - they’re basic purpose is much the same. They allow us to store and transfer wealth in a medium that cannot be corrupted.
A failing fiat system is the titanic. Gold is a lifeboat. Bitcoin is just another lifeboat. One is slower and more stable, the other is faster and less stable. Both are alternatives.
When the broad money supply goes up, whilst the supply of Bitcoin and Gold remains approximately the same, and the perceived value of both either remains the same or increases, their price rises.
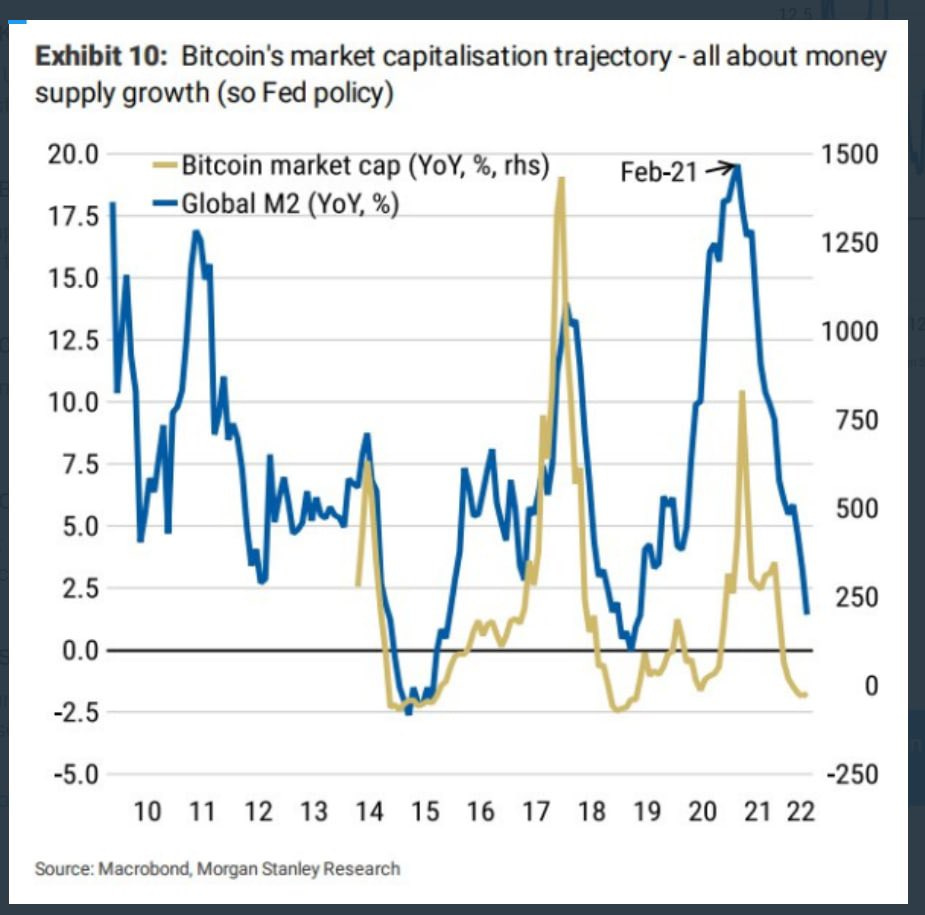
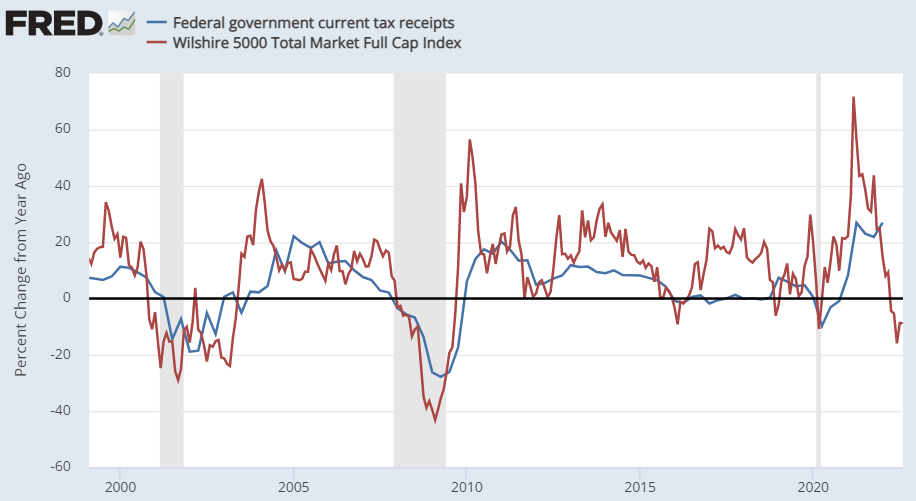
Here is a chart from the bank Morgan Stanley research that overlays the year-over-year change (percentage change from a year ago) in the global M2 with the year-over-year change in the market cap (price * supply) of Bitcoin.
And another beautiful chart by Raoul Pal showing the same thing but with the total crypto market cap:

The reason we use year-over-year data when comparing M2 to Bitcoin is because it is still in its nascence, i.e. not yet fully established, unlike gold, therefore it is actually outpacing the growth in the money supply.
Bitcoin Price divided by M2:
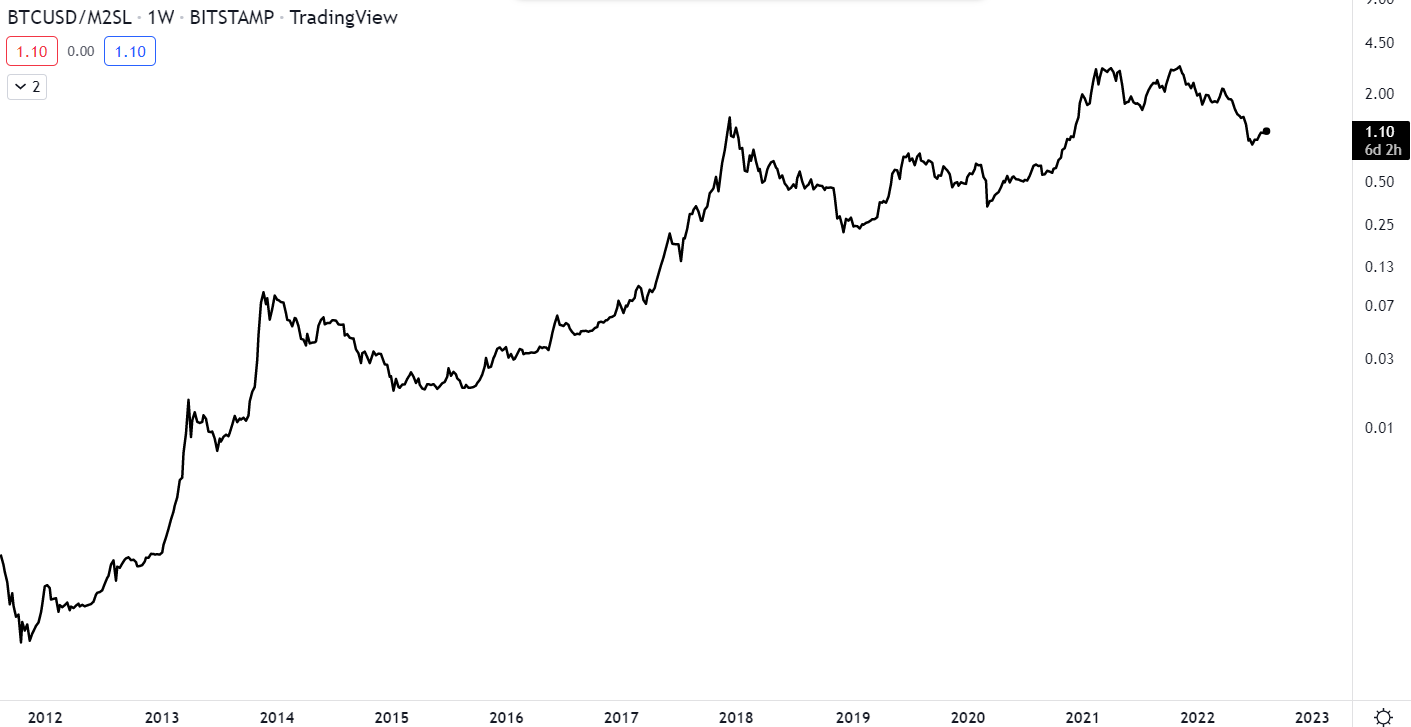
This just looks almost the same as a normal Bitcoin price chart. Gold is perceived by the whole world to have value. Only a small portion of the world perceives Bitcoin to have value, yet this portion is ever increasing, therefore Bitcoin outpaces the growth in money supply. Until this gap closes, it is likely Bitcoin will continue to outpace gold and the growth in money supply.
The reason both of these assets are confused with ‘inflation hedge’, is because the debasement of money often leads to inflation. Not always, but often, hence the mix-up. Gold and Bitcoin both performed spectacularly following the Covid money printing, but now that inflation has hit, they are naturally struggling. The Fed is tightening, M2 is flat, and the dollar is very strong. They protected investors against the debasement, but not the inflation of the CPI.
“I don’t think gold or Bitcoin. They don’t hedge inflation, and I just go to one simple observation. Neither one of them are in the CPI.”
“I will tell you this. The one thing I am comfortable about that gold will hedge; it will hedge debasement against the dollar. By the way, we’ve seen enough to know that dollar debasement does not mean physical inflation.” - Jeff Curie, Global Head of Commodities Research at Goldman Sachs
When the Fed finally pivots, inflation picks up and growth struggles to return - stagflation - businesses will struggle. However, Gold and Bitcoin do not struggle. One is a shiny metal rock, the other a cool piece of revolutionary software. They don’t have to pay workers or deal with poor sales. This is likely one of the reasons why gold outperforms equity so much during these periods. Let’s see if Bitcoin does the same.

What About the Debt?
The common argument for a quick pivot is the crazy high debt to GDP, which I’ve spoken about in previous newsletters.
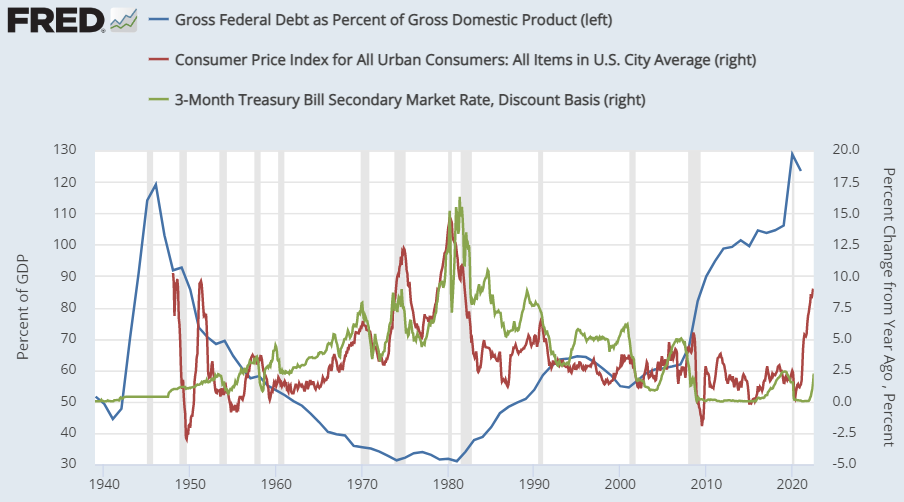
Like the 40s, the high debt to GDP is the reason interest rates are not at the rate of inflation and the reason why they cannot afford to let real interest rates go too high for too long. They have so much debt, they can’t let the cost of servicing this debt to go too high. However, it is all about time perspective. This still takes a long time to play out and real interest rates are still very negative. The US Treasury Department doesn’t intend to issue a lot of net Treasuries through September 2022, as their reserves are pretty high, and the timing of tax revenues and government expenditures is in their favour during Q3 of this year.
But eventually, the economic deceleration and destruction in asset prices will start weighing in on tax revenue.
By Q4 of this year or during the first half of next year, Treasury issuance will likely have to start picking up to fund their federal deficit. This is when the Treasury market will be vulnerable to liquidity problems (lack of buyers), and this is when the Fed will have to step in with QE or something equivalent. An alternative would be if they change SLR ratio of commercial banks, forcing them to hold more assets, like treasuries. However, until then, there is likely to be much more pain for markets.
There are some analysts, like Luke Gromen, who expect a pivot as soon as this month, and others who don’t see one until at least next year. Essentially there is a huge range, and no one knows for sure, but what we do know is that employment is still high, inflation is still high, and there hasn’t yet been severe liquidity problems in the treasury market, so the Fed is likely going to keep tightening for now.
Before we move onto a Bitcoin update, I want to credit to Zoltan Psozar from Credit Suisse, Bridgewater Associates, David Hay and Lyn Alden, as this is largely my digestion of their brilliant works.
Update on Bitcoin Bottom Indicators
Finally, a quick update on some of the Bitcoin indicators we’ve been tracking.
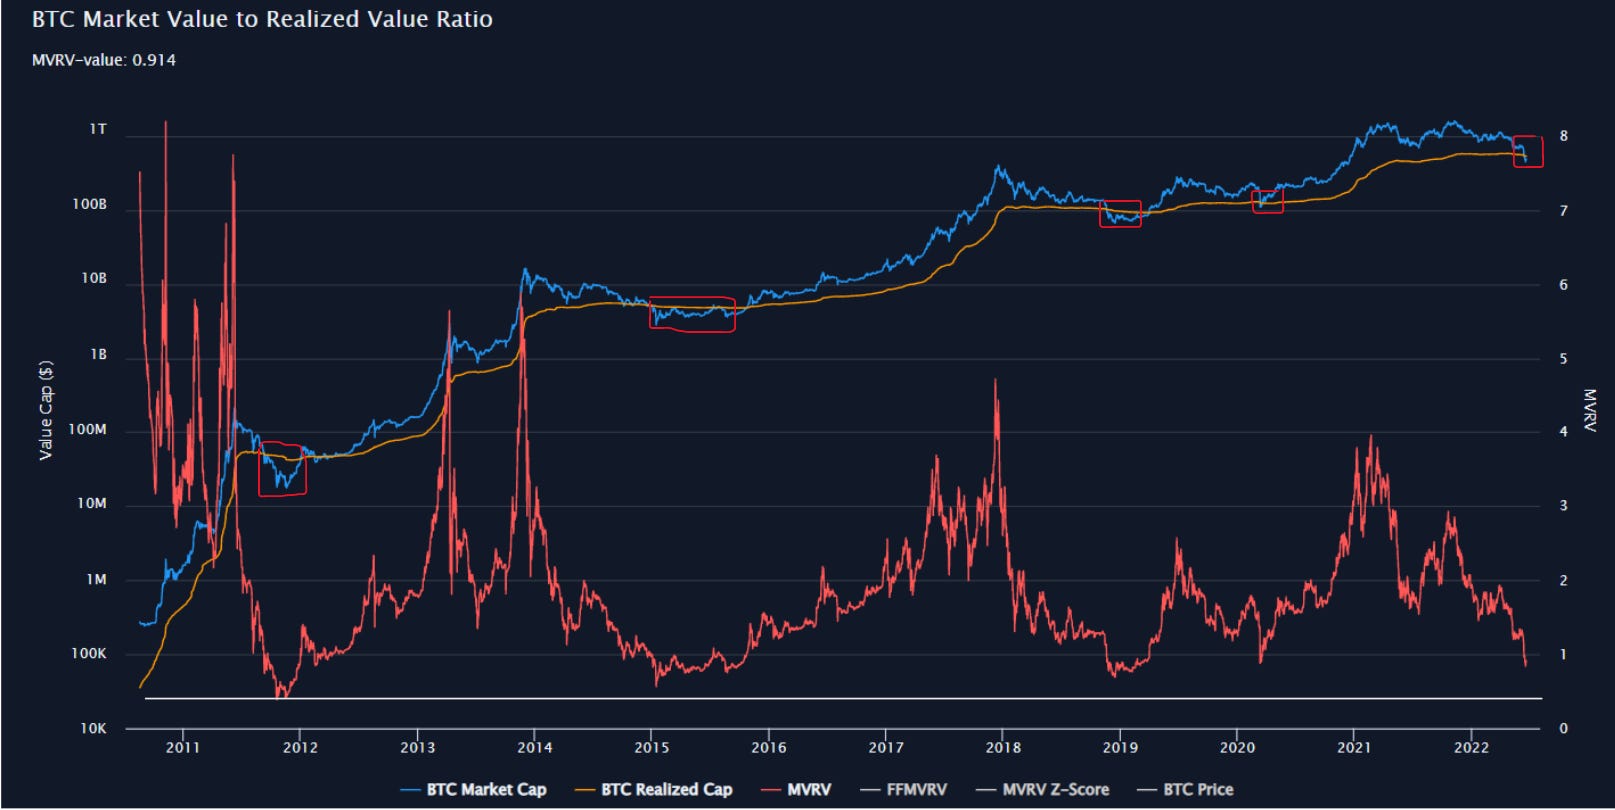
Market Value to Realised Value (MVRV)
The realised price of a single Bitcoin is the value of the Bitcoin the last time it was moved (sold/bought/transferred). The realised value of Bitcoin is the value of all Bitcoin (including Bitcoin bought years ago) at the price they were last moved. The MVRV is the ratio of the current market cap (supply * price) to the realised value.
Last newsletter:
BTC price (blue), Realised Value (orange), Mkt Cap/Realised Value (red)
Updated:
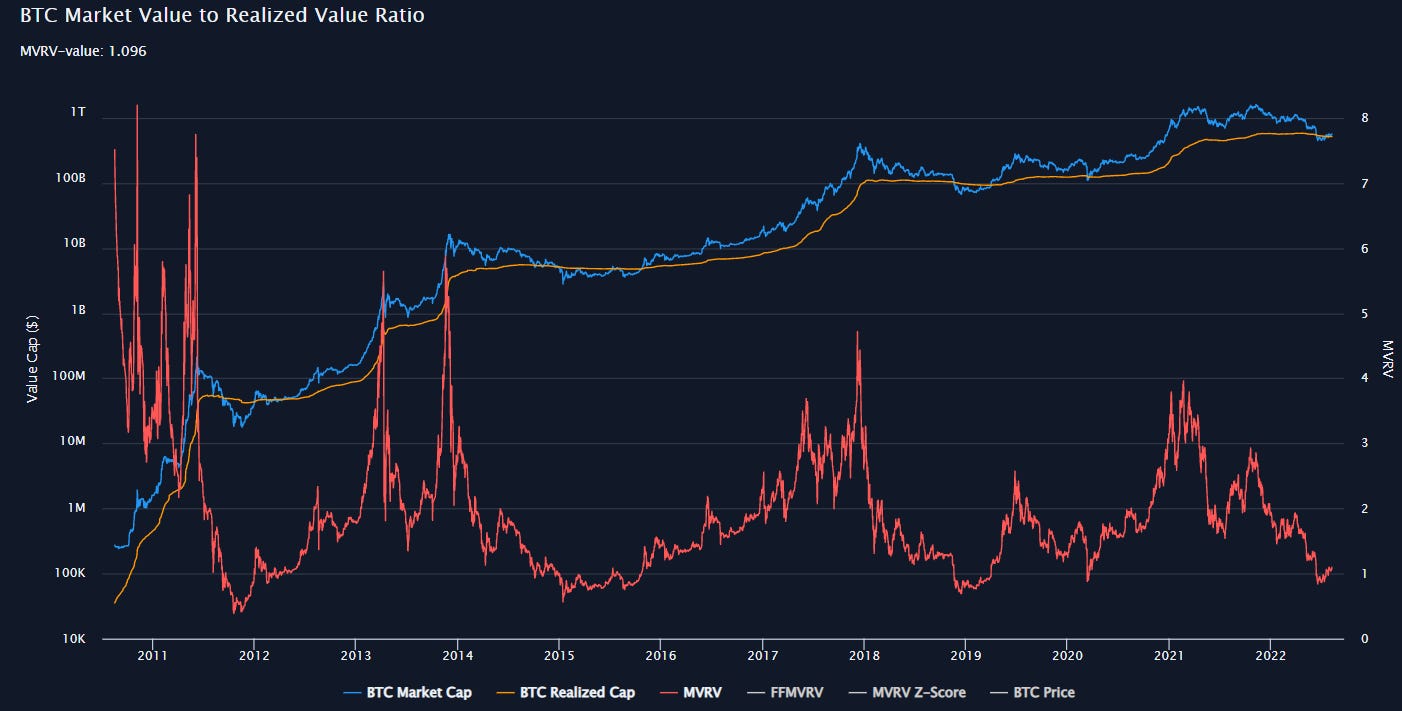
This remains in deeply oversold territory. This has historically been lower, but we are in the region where major bottoms are formed.
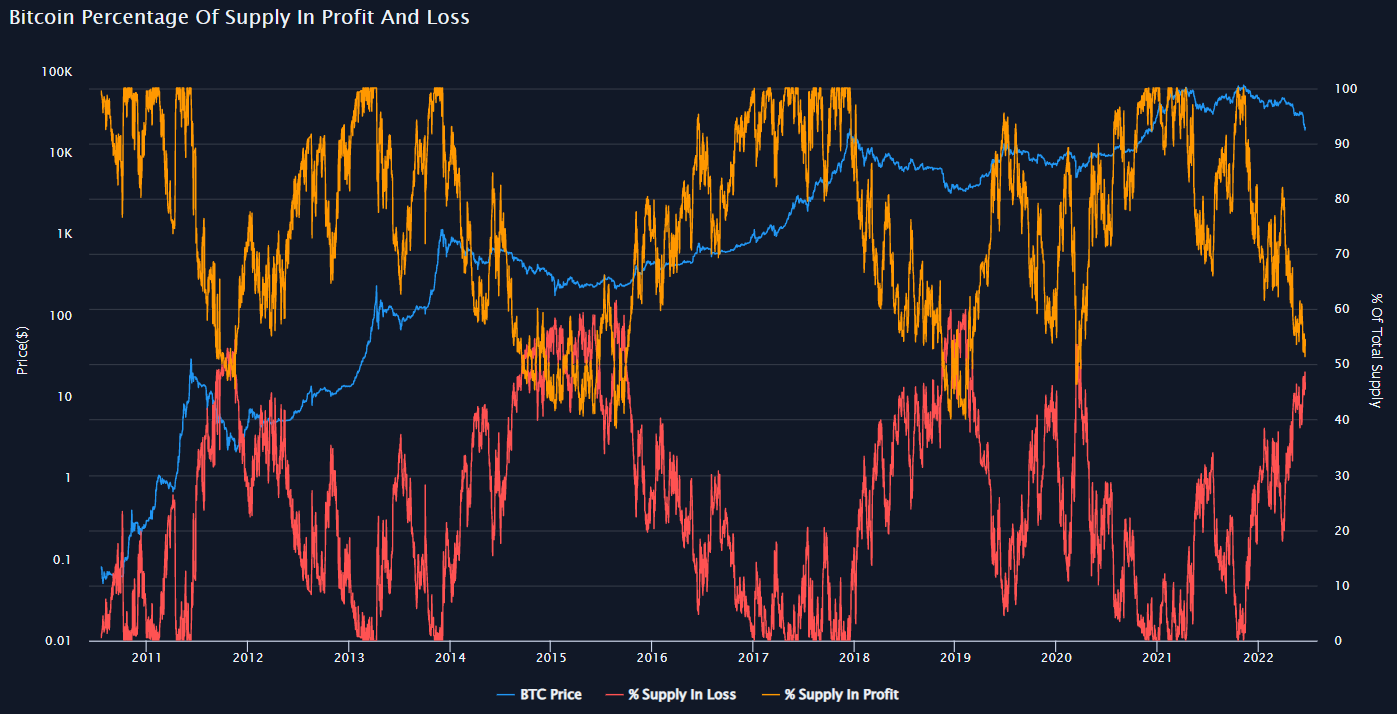
Percentage of Supply in Profit and Loss
The percentage of coins whose current price is lower than when they were last moved (sold/bought/transferred), is the percentage of supply in loss. The percentage of coins whose current price is higher than when they were last moved (sold/bought/transferred), is the percentage of supply in profit.
Historical bottoms have occurred after there is a crossover between supply in loss and profit, so that there is in fact more supply in loss than profit.
Last newsletter:
Supply in loss (red), Supply in profit (orange)
Updated:

We are close, but the cross is yet to occur. This one indicates we have further to go.
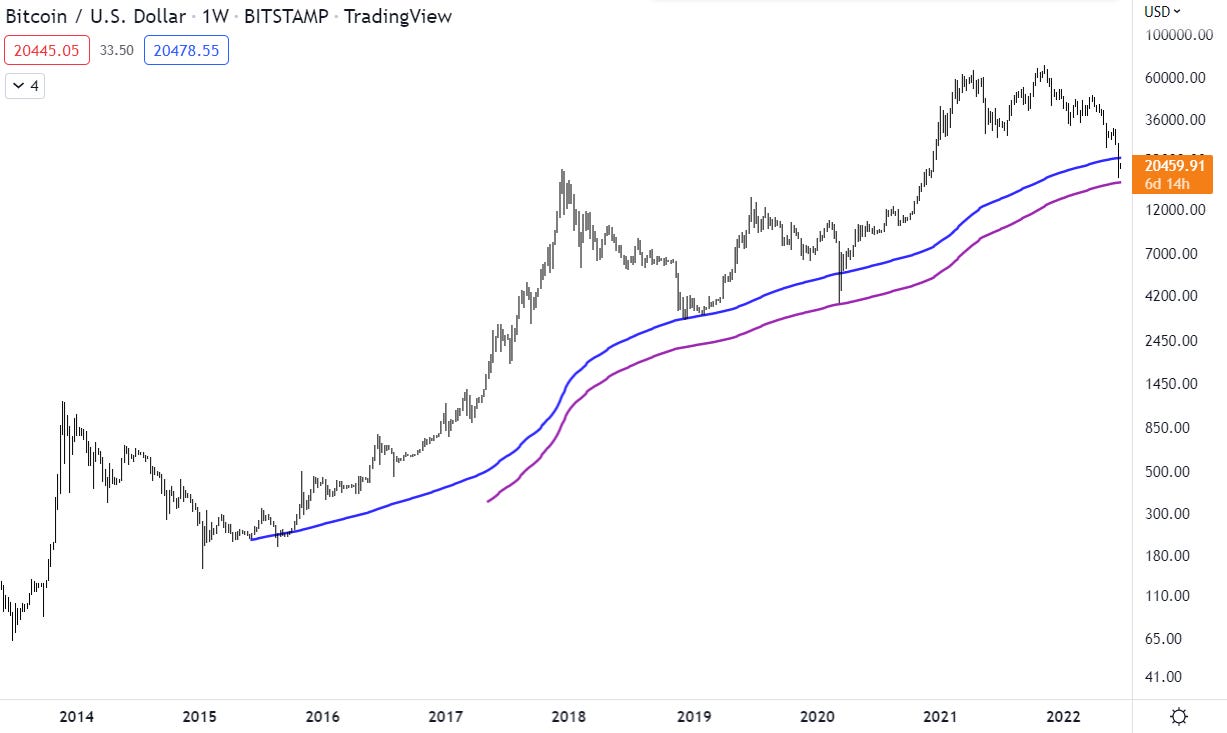
Moving Averages
A moving average captures the average change in a data series over time. The 200-week moving average is simply the average price of the last 200 weeks of Bitcoin price.
Last Newsletter:
200-week MA (Blue), 300-week MA (Purple)
Updated:
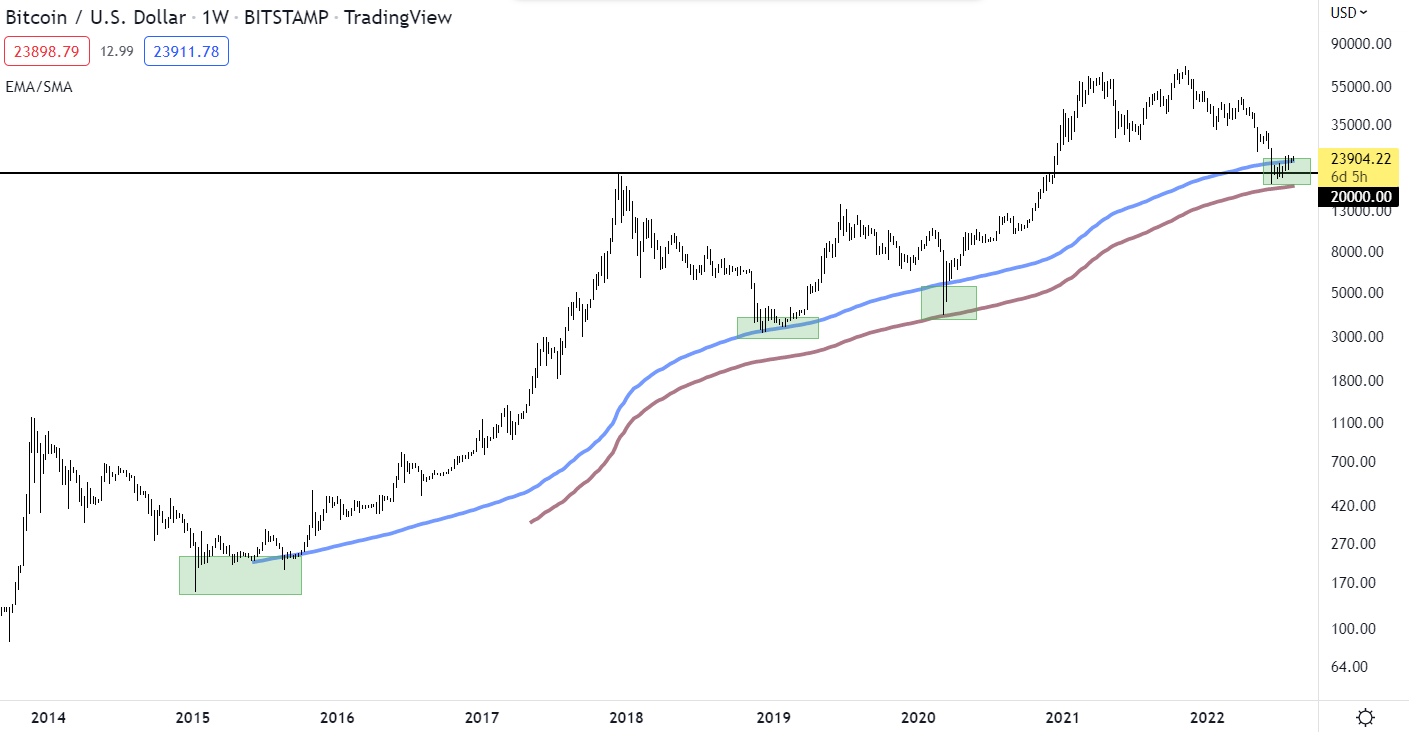
This is one of the few that were indicating a bottom was in. We are currently still meandering in this area of value, which coincides with the previous all-time high, $20k. If this is the bottom, continued meandering sideways would be expected as it builds out a base.
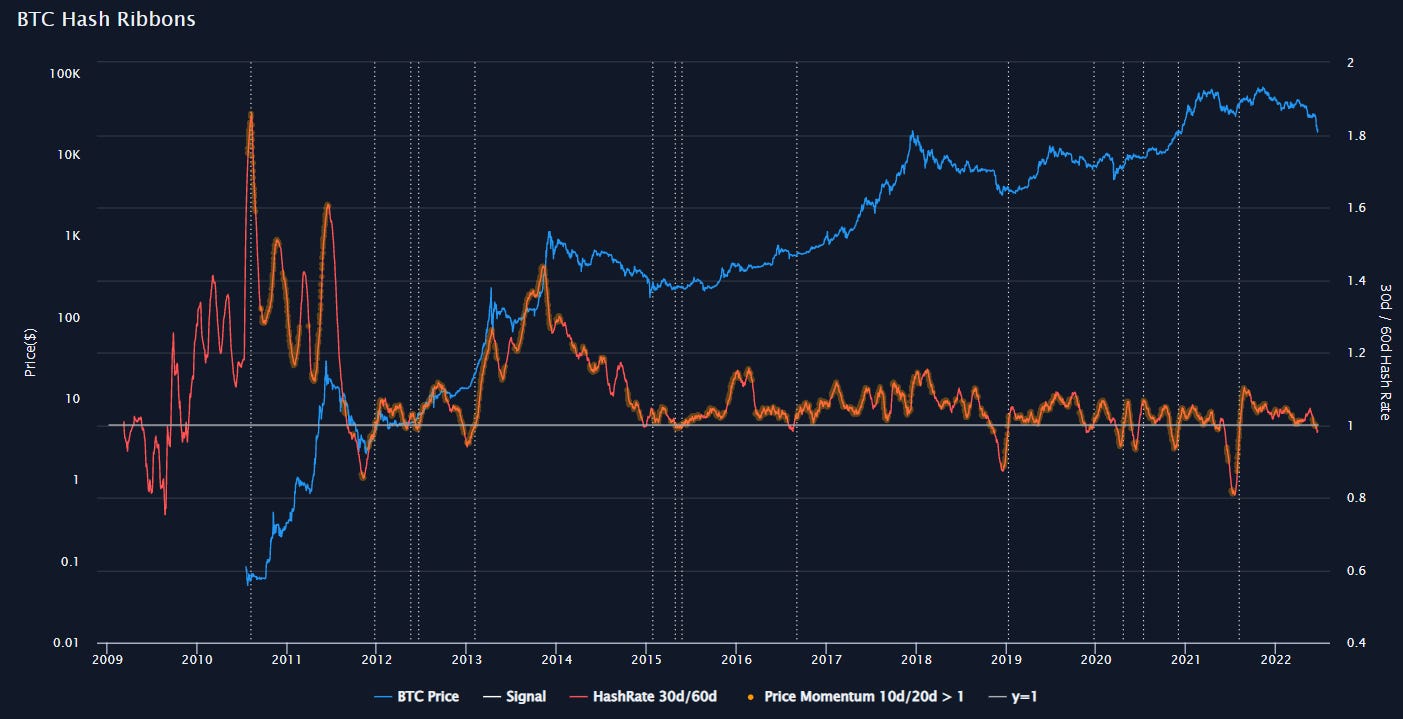
Hash Ribbons
An indicator which has historically flashed just after the bottom of all previous bear markets.
Hash ribbons is a local bottom predicting indicator that is based on the hash rate of the network. More specifically, it is based on crossover of the 30-day simple moving average (SMA) of the hash rate, with the 60-day simple moving average (SMA) of the hash rate. In this way we compare shorter-term hash rate changes to longer-term hash rate changes. The 30D SMA of the hash rate crossing below the 60D SMA signals a miner capitulation. The first instance of positive momentum after a recovery of the hash-rate (30D SMA crosses above 60D SMA) has historically been a rewarding place to buy with limited downside. This is combined with 10d price SMA divided by the 20-day price SMA which represent price momentum. A signal using momentum occurs at the first instance of the 10d/20d ratio being above 1 after a hash rate recovery (30D SMA of hash rate crosses above the 60D SMA of hash rate). The graph plots the 30D/60D hash rate in orange and a bullish cross happens when this rises above 1. The signal then occurs if, or once, the 10d/20d price ratio is above 1.
Last Newsletter:
Bottom signal (vertical white dotted line)
Updated:
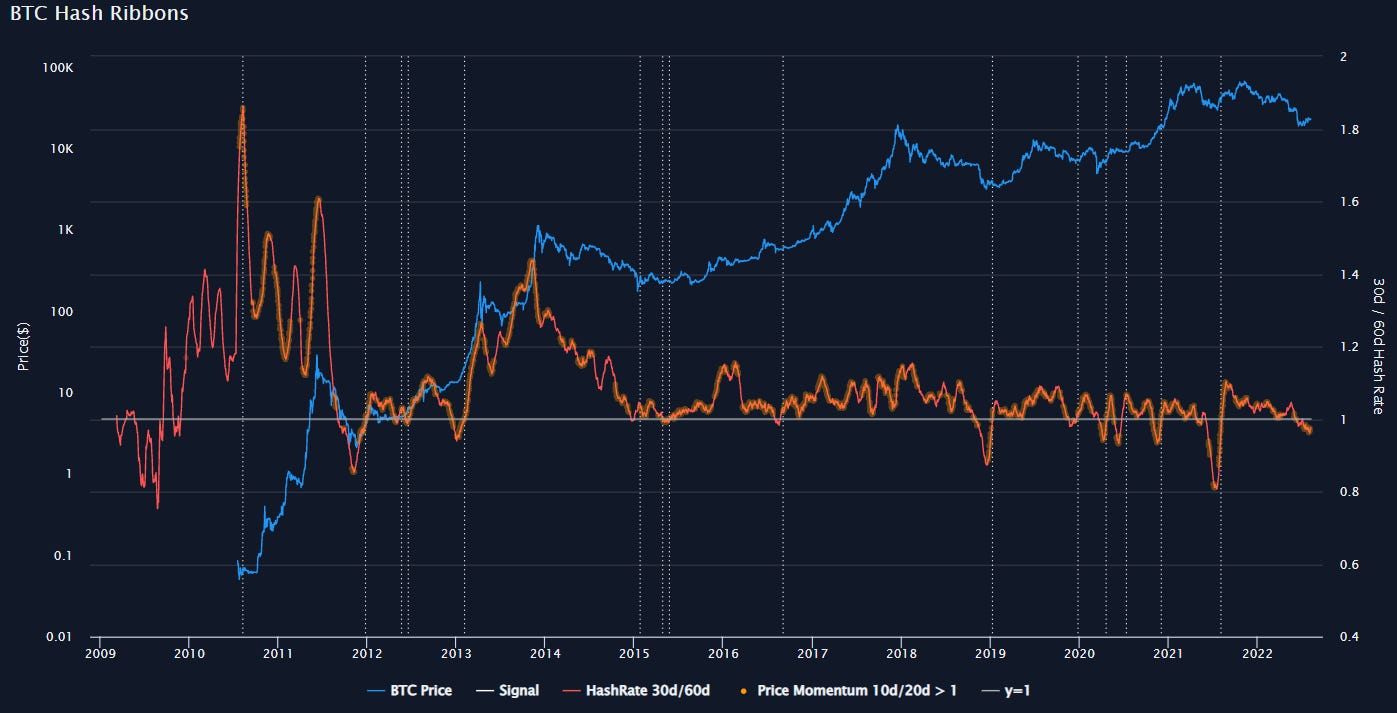
This indicator is yet to flash, signally we have a bit longer to go before we can more confidently say the bottom is in.
Volume/Capitulation
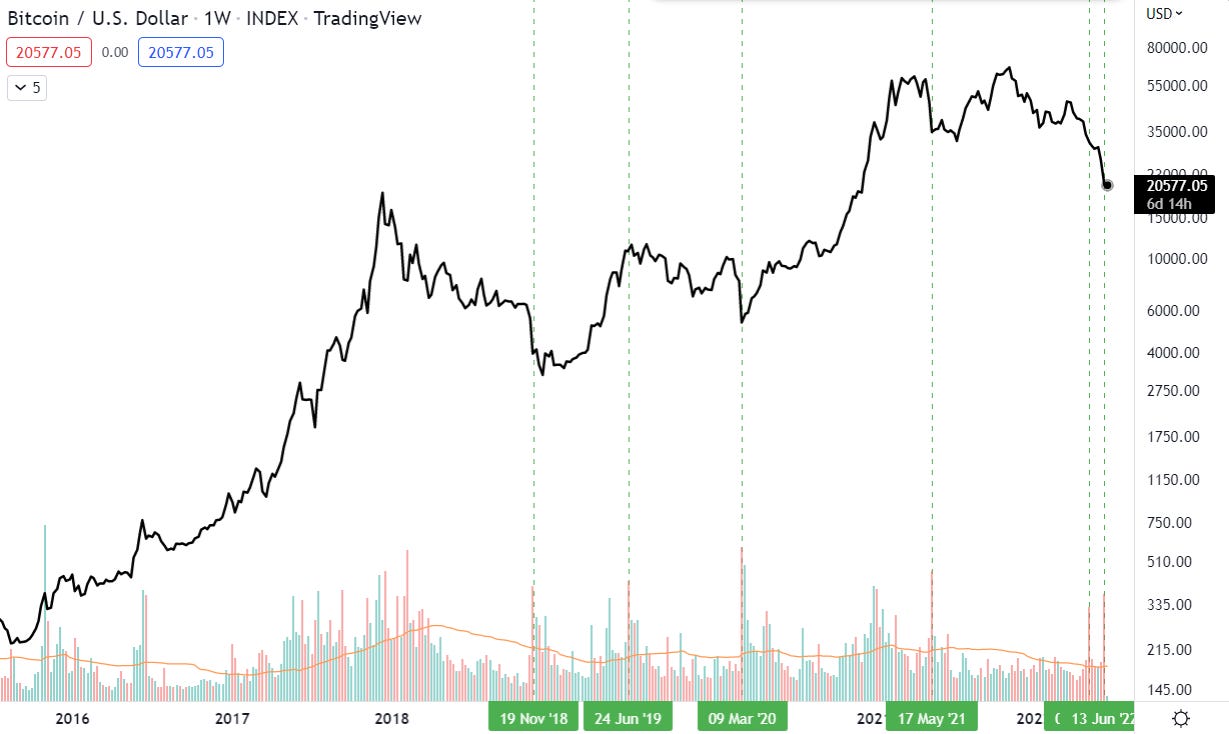
A volume spike, following a period of low volume, usually marks reversal points pretty well, as it is a sign of capitulation - lots of panicked/forced selling.
Last Newsletter:
Volume in green and red bars below, with dotted green lines to mark spikes.
Updated:
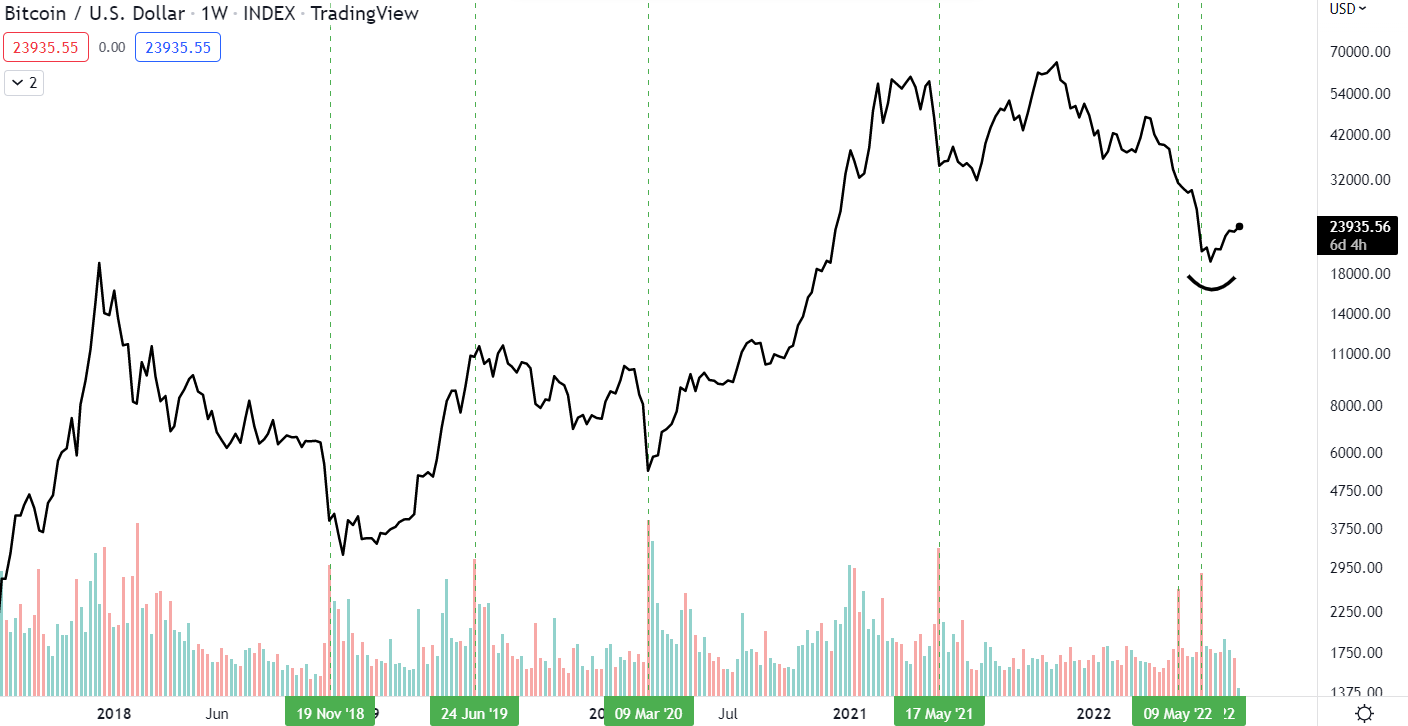
This was an indicator pointing towards at least a local bottom, and this is indeed what has played out. This shows we have had 2 capitulations and is one of the indicators saying that the worst could be behind us.
Horizontal Support/Resistance Levels
Last Newsletter:
Updated:
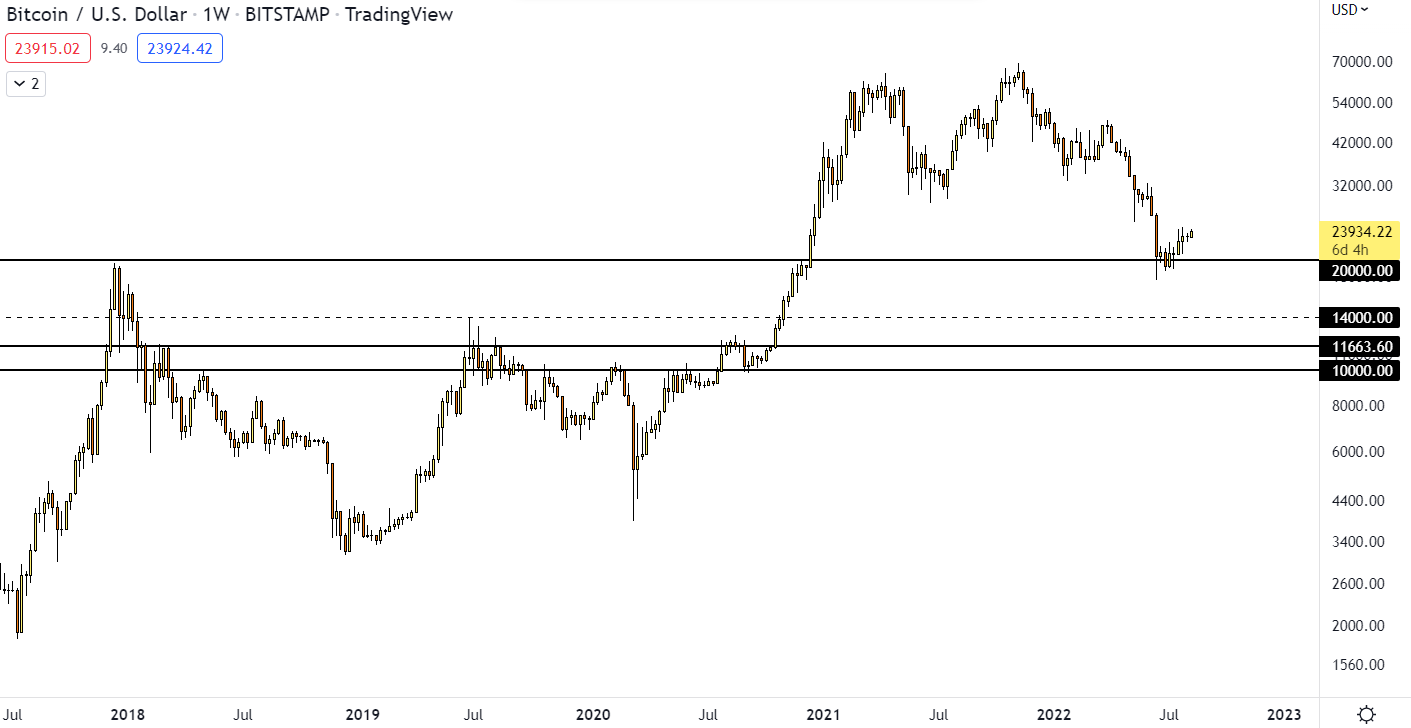
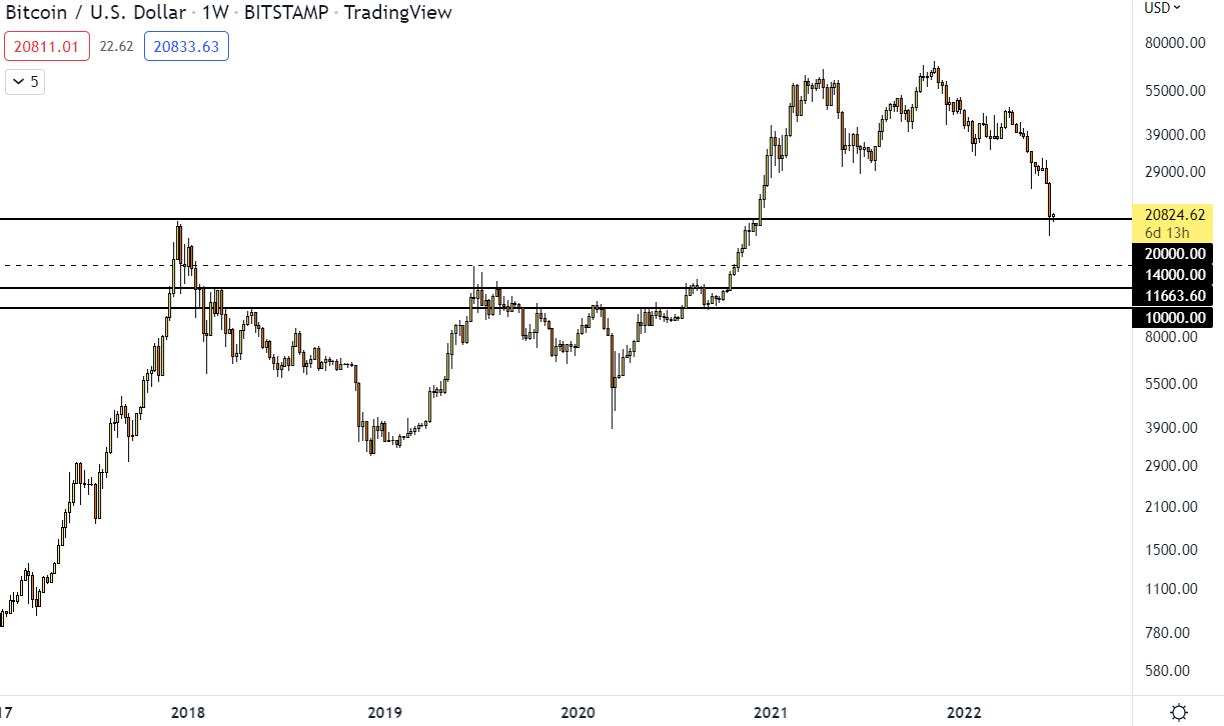
The outer defence of Helms Deep has successfully defended against the first attack of the Uruk-hai. If it is convincingly breached, $14k is the next clear support. If there is another significant leg down in the stock market, this could be the bomb that breaks the outer defence.

Hopefully Legolas will come and save us.

Although it feels like it’s been a while, I’m afraid that nothing much has really changed. A few indicators are indicating a bottom, but there are a few that are yet to flash. One thing we do know is that we are in deeply oversold territory where historical bottoms are formed. For those looking to get exposure, I see dollar cost averaging here as the best plan.

For more confirmations that the bottom is in I want to see:
Hash Ribbons bottom signal
Inflation topping and/or
Fed Pivot
Until then, the game remains the same. I continue to remain Bitcoin heavy with a good portion of cash on the side. I have bought at these levels, and if we fall lower, I shall be buying more. Outside of crypto, I’m also very slowly layering into like commodities, precious metals, long duration bonds and large-cap dividend stocks.
“In bull markets, people have faith; in bear markets, doubt. The other way around might be more profitable.” - Jim Grant
Until there is more confirmation of returning to a risk-on environment, I have no interest in picking up altcoins. They can fall further than Bitcoin, hence the extra caution.
Bits n Bobs
The Evolution of BlackRock:

2 Brilliant Podcasts:
An Excellent Book:

A Great Lightning Network Report by Lyn:
https://www.swanbitcoin.com/a-look-at-the-lightning-network/
2 Acts of Brilliance:


Pure Hilarity:

That’s all for today. Enjoy the rest of summer and see you next time!
All the best,
Tatsuki
Library
Bullish - Causing, expecting, or characterized by rising stock market prices.
Bearish - Causing, expecting, or characterized by falling stock market prices.
Bear Trap - Tricking everyone that price is going to break down, before moving up.
Bull Trap - Tricking everyone that price is going to break up, before crashing down.
DCA - Dollar Cost Average. Investing incrementally on fixed schedule.
DEX - Decentralised exchange.
EMA - Exponential moving average
ETF - Exchange traded fund. A type of security that tracks an index, sector, commodity, or other asset, but which can be purchased or sold on a stock exchange the same way a regular stock can.
Fed - The Federal Reserve, central banking system of the US.
Fiat Currency - Fiat money is government-issued currency that is not backed by a physical commodity, such as gold or silver.
FOMC - The Federal Open Market Committee (FOMC) is the monetary policymaking body of the Federal Reserve System.
Fractal - Repeating patterns from the past.
HODL - To hold your coins and not sell them despite crashes in price.
MA - Moving average.
S/R - Support/Resistance level.
Stablecoin - A cryptocurrency pegged to a traditional fiat currency, like the dollar.
Whale - A very large holder of Bitcoin.
The information contained herein is for informational purposes only. Nothing herein shall be construed to be financial legal or tax advice. The content of this email is solely the opinions of the write who is not a licensed financial advisor or registered investment advisor. Trading cryptocurrencies poses considerable risk of loss. The writer does not guarantee any particular outcome.