
Supply, Demand, Stablecoins and Market Cycles!
Supply, Demand, Stablecoins and Market Cycles!

Hey Guys,
It’s been absolutely gorgeous recently, and I hope you have all been enjoying the good weather. I’ve been for a few sea swims, and can confirm that the sea is yet to get any warmer, but it’s lovely nonetheless.
It’s been a pretty boring few months in terms of price action, but there is volatility around the corner. Bitcoin has been coiling up for quite some time now, and an aggressive move is likely coming soon, either up or down.
This week I dive into an on-chain indicator that looks slightly more at the demand side of the equation, and also have a great thread on hashing functions which are a key component of a blockchain.
As always, if you can think of anyone who would find this useful, please share this newsletter with them, using this juicy button:
And they can subscribe here:
Beginners Section
Just a nice short one today; A great thread on Hash Functions, which are key to the workings of Bitcoin.

Bitcoin Supply and Demand
We’ve spoken a lot about the supply side of Bitcoin in the past, and the general conclusion has been that the supply side of Bitcoin is very tight.
To recap, here are a few of the charts that show this:

This shows that over 63% of the entire Bitcoin supply hasn’t moved in over a year. This is almost the highest it has ever been. This shows an immense amount of Bitcoin is being held by long term holders who have not been phased by the last year of volatility.
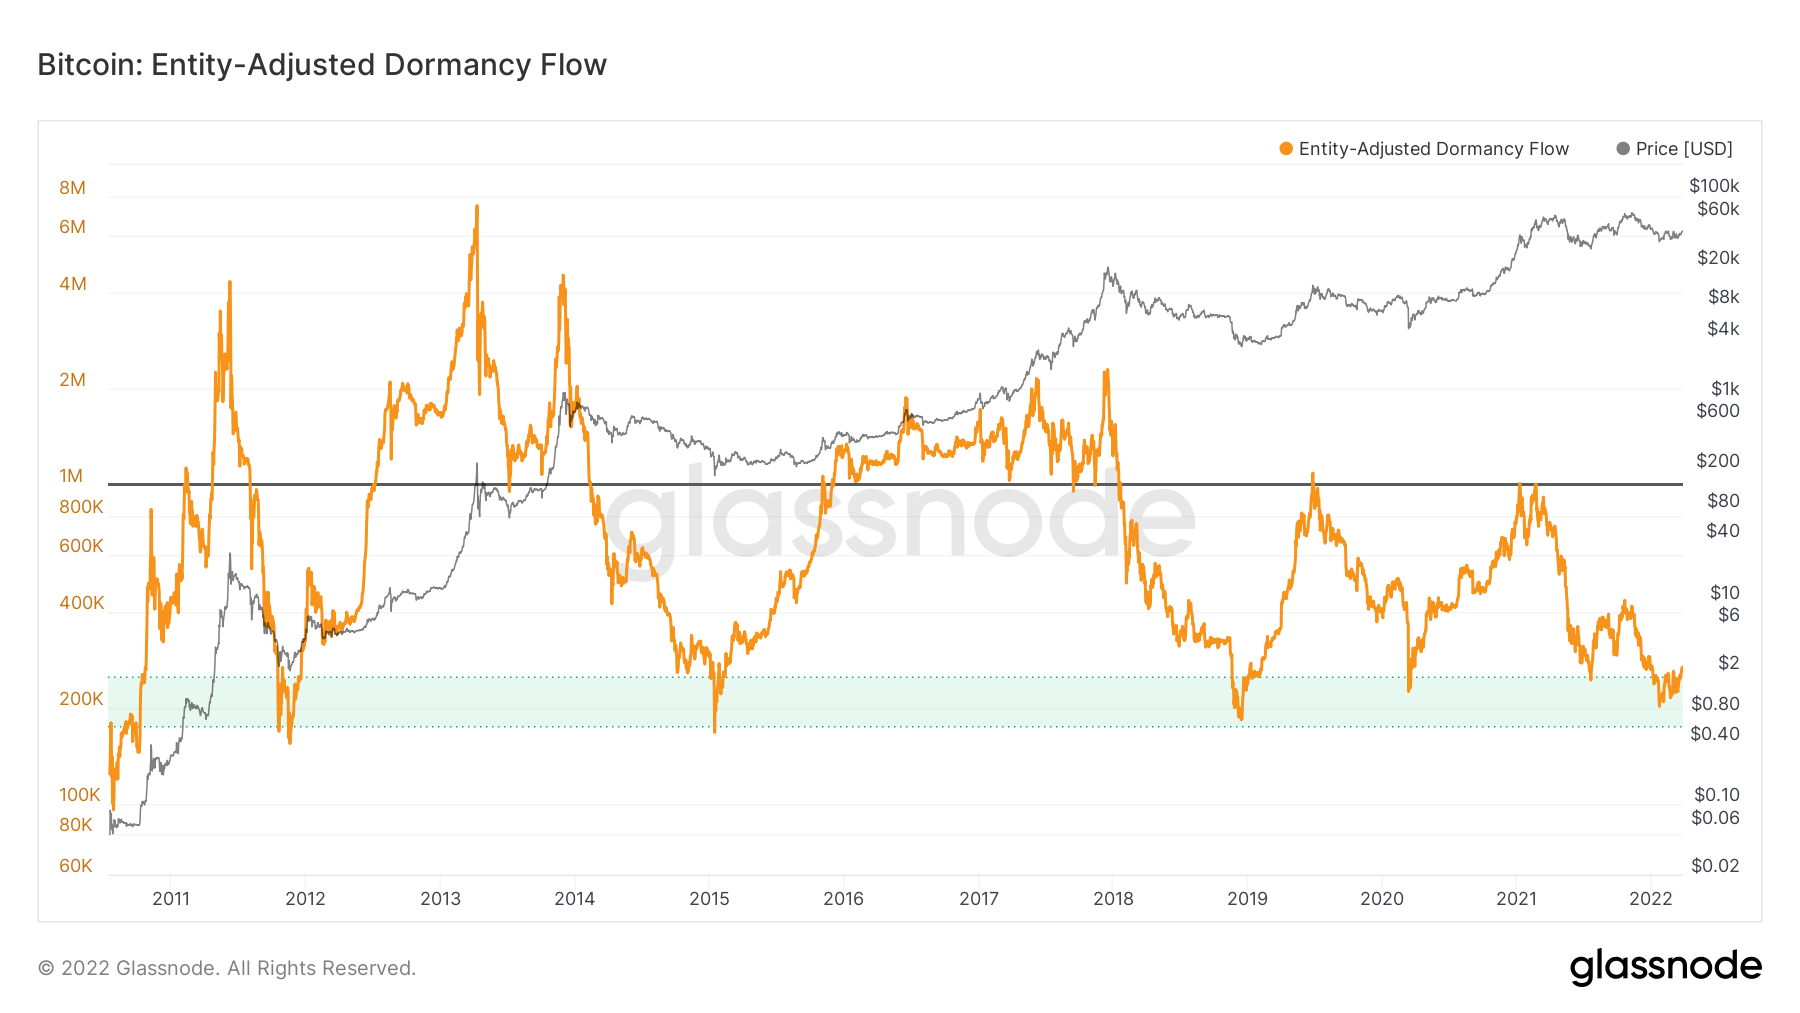
An indicator which can be thought of as the amount of supply being sold by long-term holders. The lower it is, the less selling there is from long-term holders, and this just reached the 4th lowest in history. Another indication supply is tight.
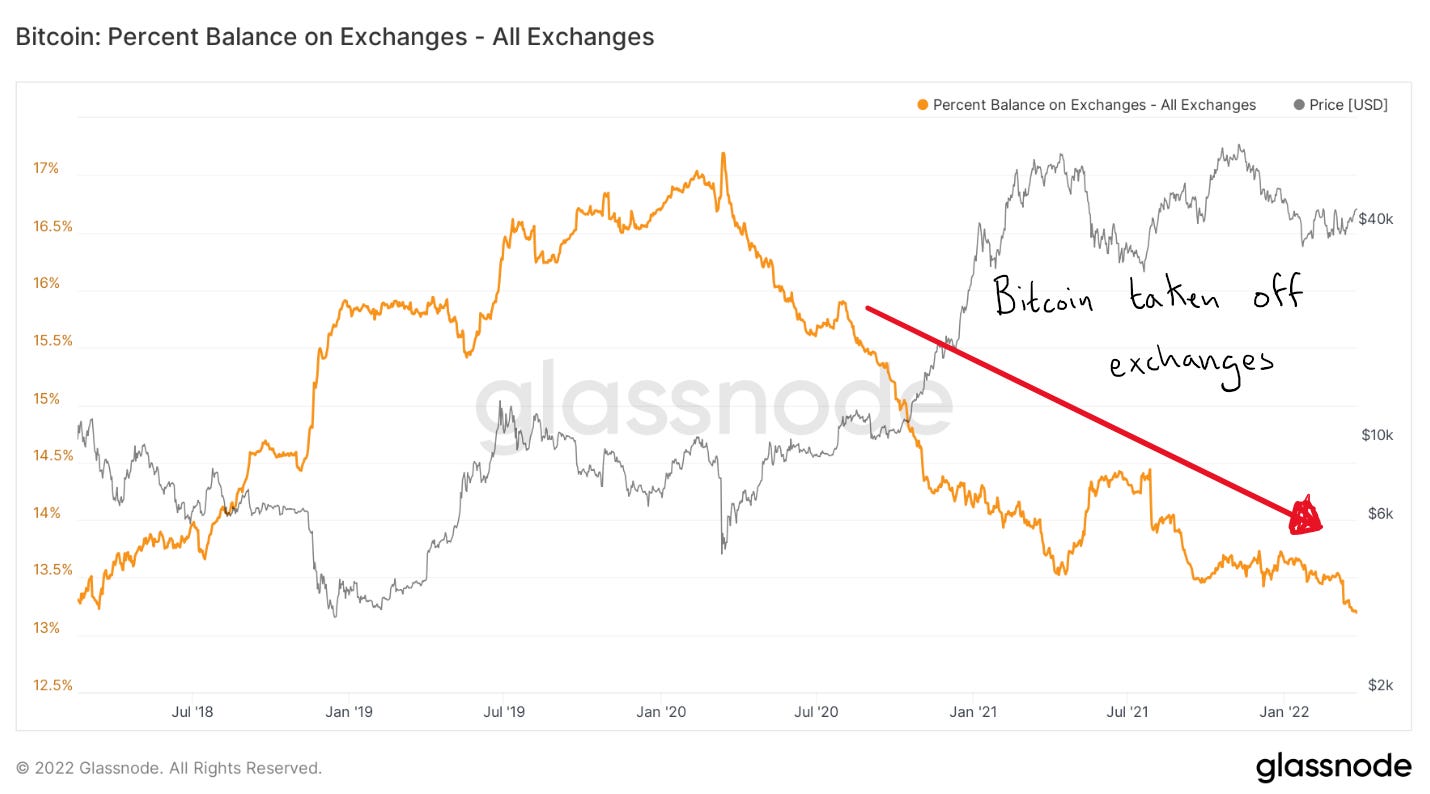
Finally, the amount of supply held on exchanges just keep falling. This means Bitcoin is being removed from exchanges into self custodial wallets. There is only 13% of Bitcoin supply still being held on exchanges.
Yet despite the tight supply, we’ve seen price pretty much go down and sideways for quite some time now, and this is most likely due to the lack of demand. The lack of demand can be attributed to the fact that many people still view Bitcoin as a risk-on asset (an asset which is risky to hold), and in general risk-on assets do badly in tightening economic conditions (rising interest rates & quantitative tightening) and times of uncertainty - exactly the environment we have been in the past few months.
Now a quick chat on market tops and bottoms. I’m sure many of you have seen the image below, depicting the typical emotions felt by retail investors during a market cycle.

For those of you are unaccustomed with this, a bull market (up trending market) starts during a time in which the consensus is that price will either keep trending down or sideway. So naturally, everyone is in a slight state of disbelief when price starts to rise. This is followed by hope, optimism then belief and by this point everyone and their mum starts investing into the market. News headlines talk of price going another 500%, people’s friends are making loads of money, so you FOMO in as well, and there is a general belief that ‘this time is different’. The price will keep going up and it surely can’t come down for whatever reason the current narrative is (which is usually based on an element of truth), whether it’s ‘tech is going to change the world forever’, or ‘the institutions are buying Bitcoin’. Then at the point of maximum popularity, everyone who would have invested has already invested, so there isn’t enough ‘new money’ to enter the market, and in the background the ‘smart money’ investors - people who understand market cycles and have clear investment plans’ - have been selling to all these newcomers who think price is going up forever. So naturally, the bubble finally pops.
Then the exact same thing happens on the way day, just in reverse and slightly faster (as fear is a stronger emotion than greed). Once again, at the point of maximum fear, when everyone thinks price ‘has to go lower’, and everyone is panic selling, the balance starts to shift once more. Everyone who would sell in fear, has already sold, so now the only people left in the market are those with ‘diamond hands’, who don’t have any intention of selling, so there is only one way the price can go; up. In addition, smart money and those ‘diamond hands’ have been buying in the background as they know that the more bearish and fearful everyone is, the closer we are to a bottom and the beginning of the next bull market.
These market cycles happen on all time frames.

Within a macro (long-term) bull market (black arrow), there will be smaller bull and bear cycles (blue) within the macro uptrend, and within this smaller cycle, there will also be even smaller cycles, as there are humans watching and trading on all timeframes.
The market is like a pendulum, and as an investor you don’t want to get caught out selling at the bottom and buying at the top. To do this, you must be a contrarian.

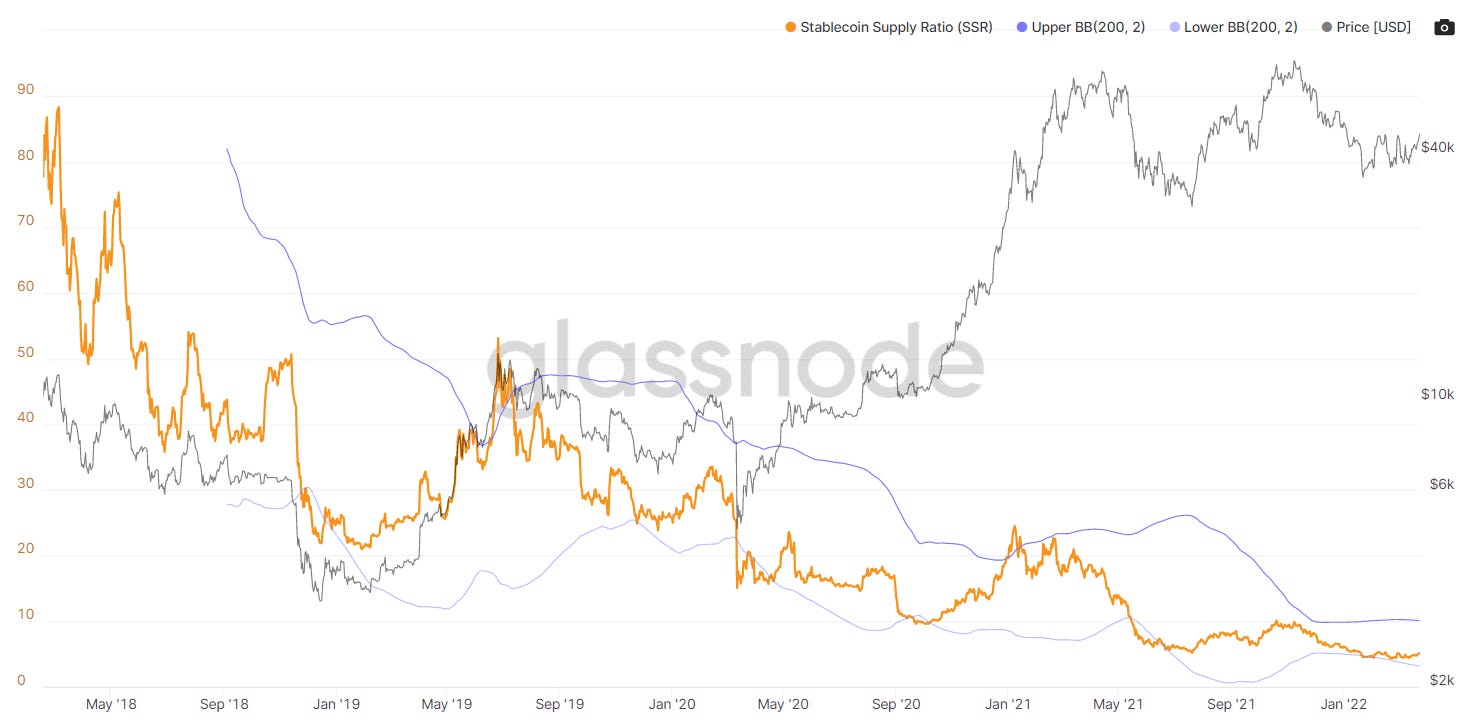
Coming back to Bitcoin, one of the ways we can visualise this cycle is by looking at the ratio between the Bitcoin supply and the stablecoin supply; the Stablecoin Supply Ratio (SSR).

Stablecoins are the cash equivalent of crypto as they are used in most transactions. If someone is going to buy or sell Bitcoin, its most likely they will be using a stablecoin, like USDT for the transaction.

The SSR can help us visualise the market pendulum by looking at how much ‘cash’ there is available to enter the market - the potential for demand (buying power). The closer we are to a bottom, the more stablecoins there will be relative to Bitcoin supply, and vice versa.
However, the SSR is not the cleanest chart to look at, as it is naturally always down trending, because the supply of stablecoins is increasing much faster than the supply of Bitcoin, because there is limited supply, whereas Bitcoin has a maximum of 21 million, of which 90% has already been mined.
A more useful chart is the Stablecoin Supply Ratio Oscillator. This looks at how the 200D moving average of the SSR moves within the Bollinger Bands (seen above in blue).
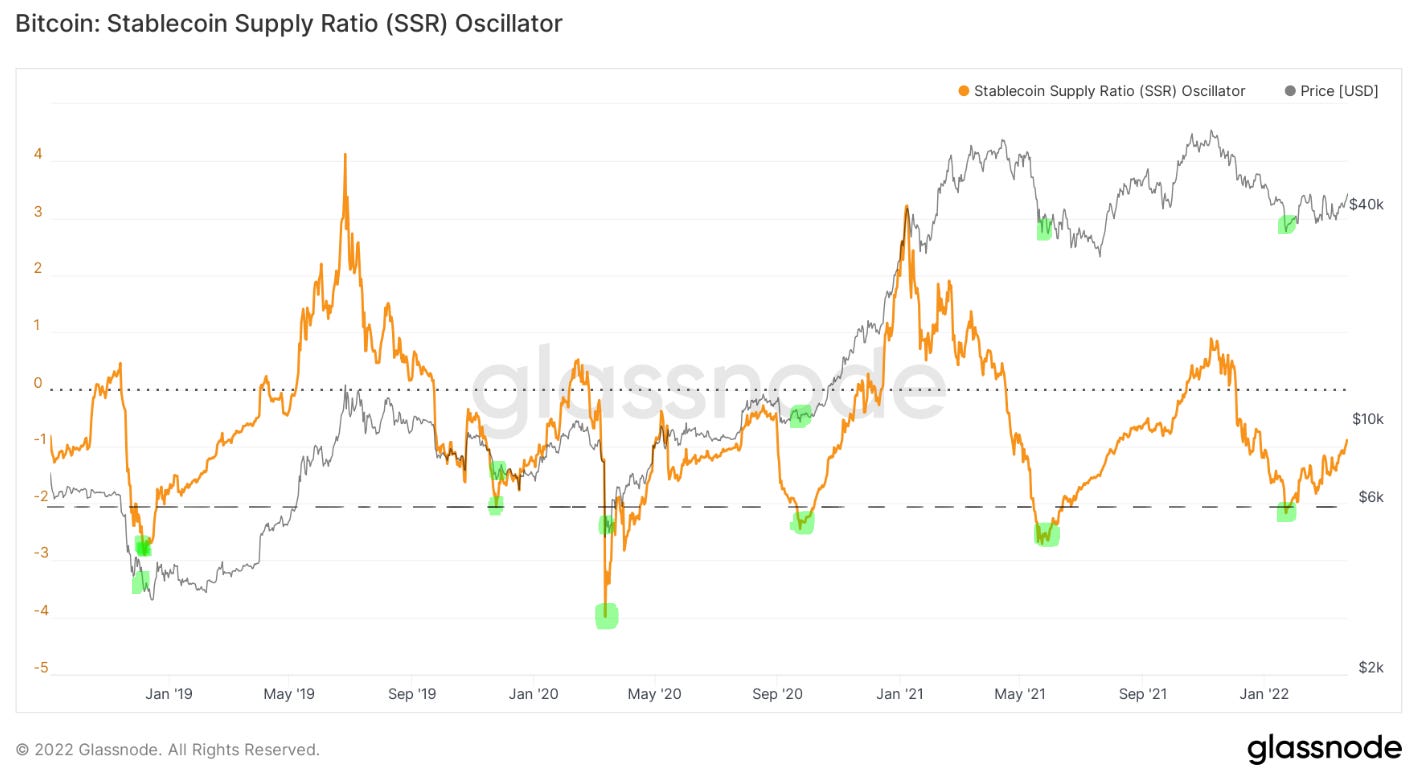
To start I have marked all the dips below -2 in green, which we can see line up pretty well with local bottoms in price. Currently, we are just rising out of a recent dip below -2, indicating a possible local bottom in Bitcoin’s price. But we must still be aware that we could have a similar scenario to March 2020, where the SSR Oscillator dipped below -2, created a small bullish divergence, made a local bottom, but was eventually followed by the March covid crash.

For those who are unaware of divergences, a divergence is when the market structure/trend of price diverges from that of an indicator, which can be an early sign of either strength or weakness and can be a useful tool for spotting reversals in a trend.
You can see the two regular divergences below:

The bearish divergence is indicating weakness and that price could be near a top, and vice versa.
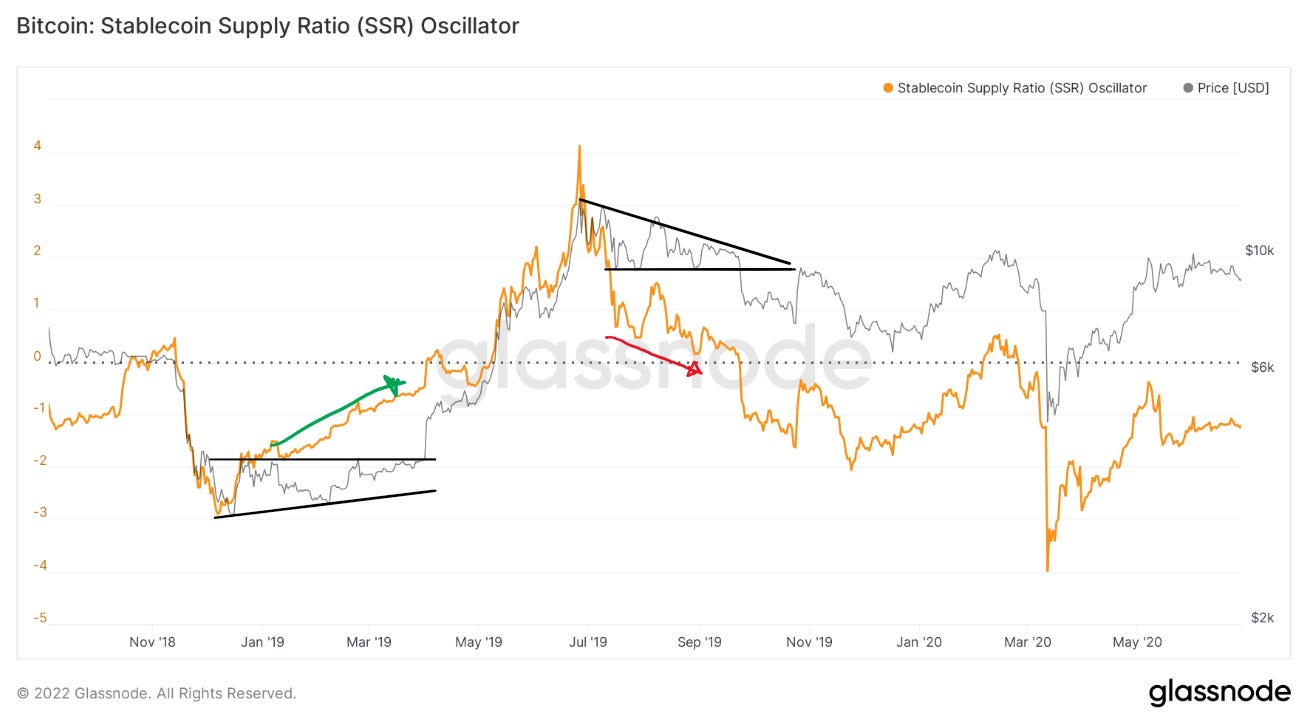
Mapping this onto the SSR oscillator, here are the most obvious divergences:
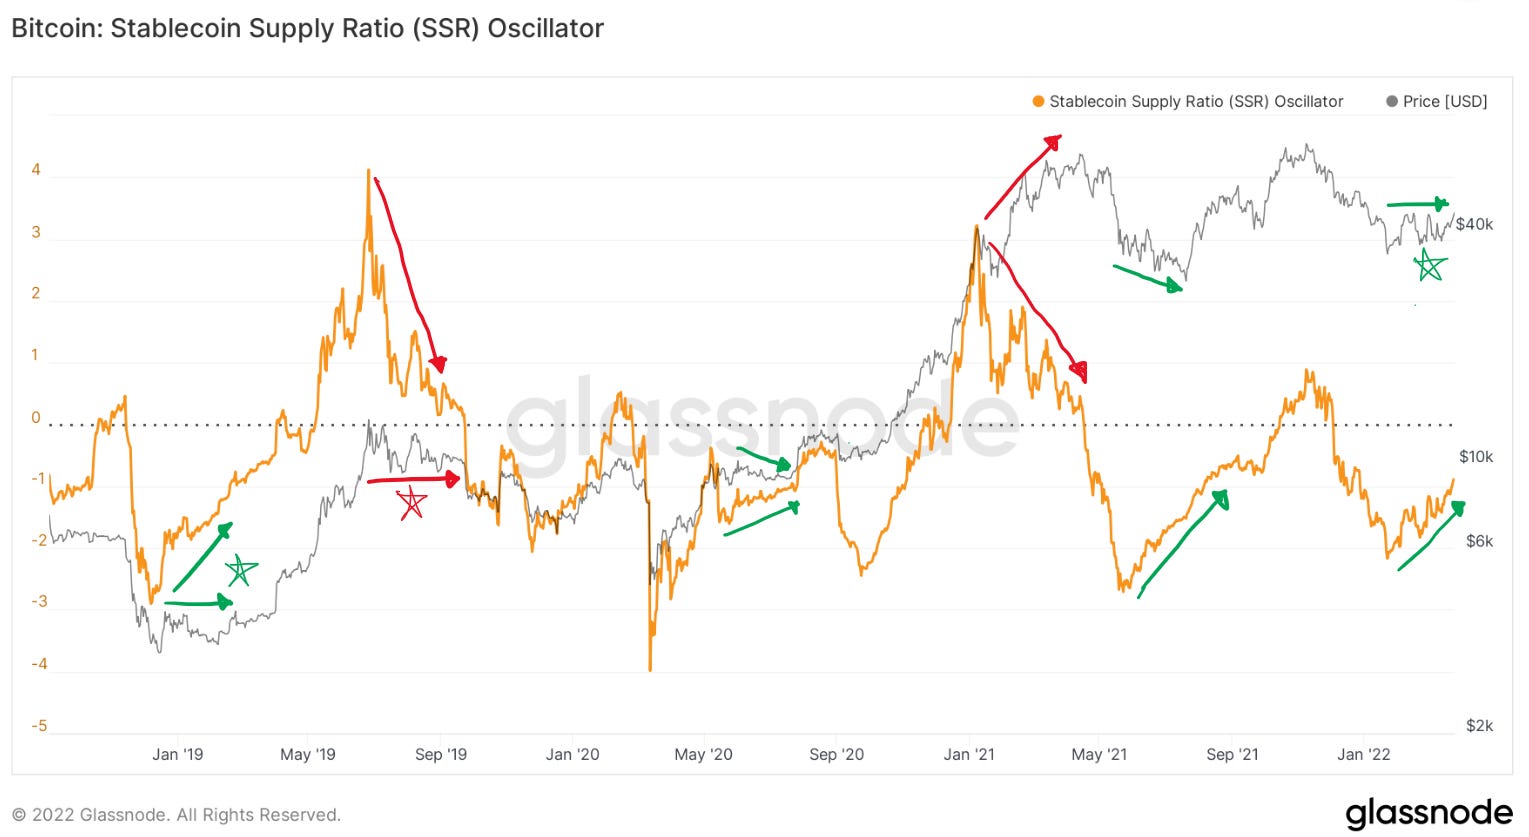
I have noted 3 with stars because they are technically not divergences, but I have drawn them nonetheless as they all showcase a similar pattern - A descending or ascending triangle with the SSR oscillator leading the direction of the breakout:
Which also happens to be the same pattern being showcased right now:
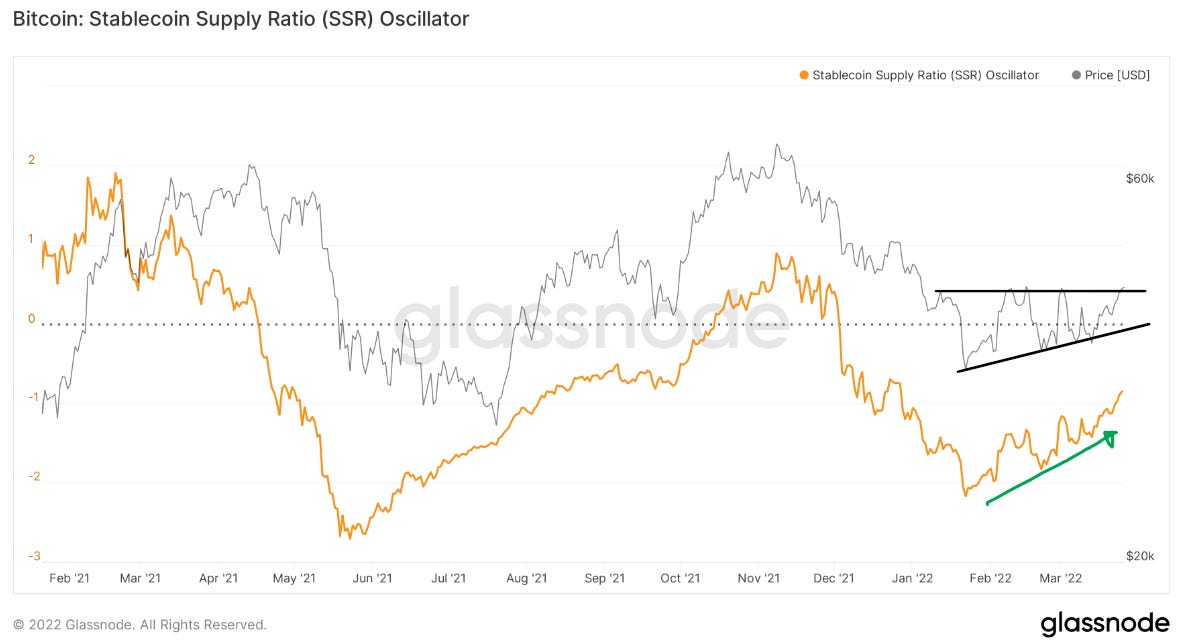
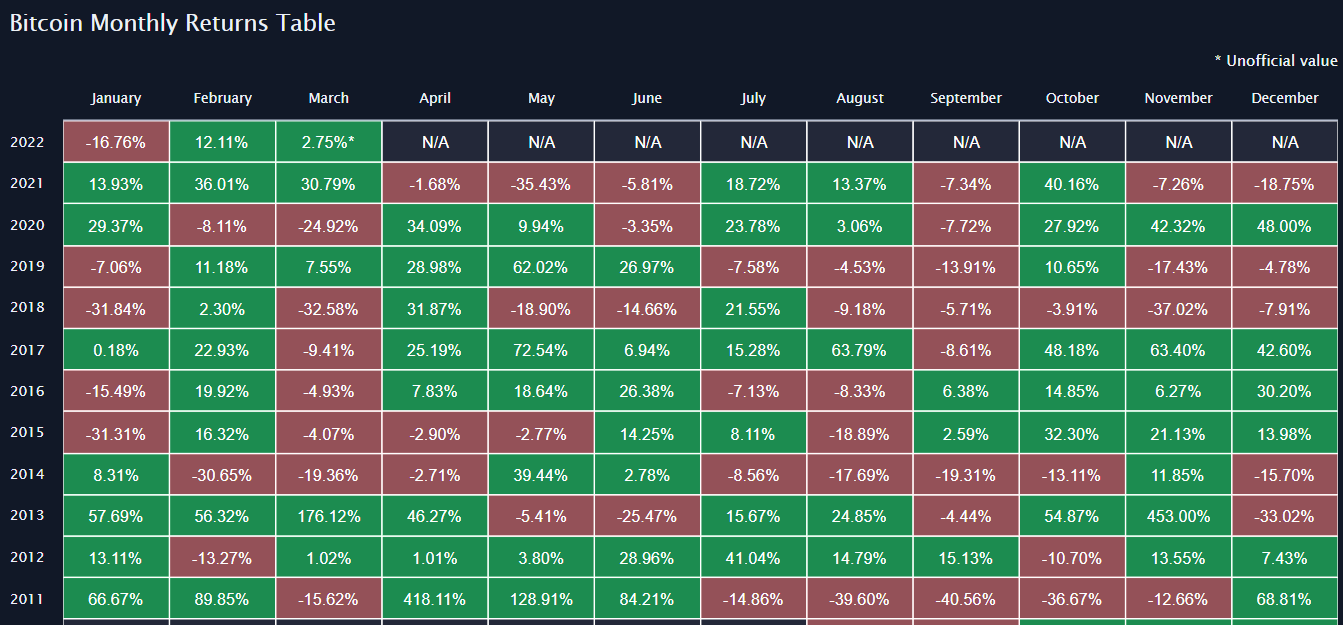
This points towards us having made a local bottom, with a possible breakout in the coming week. This ties in with April historically being the best returning month for Bitcoin:
My only qualm is that everyone once again seems pretty bullish on Twitter, when you would ideally see disbelief.
It must be said that this is all rather dubious speculation and not something to take to the bank; more to observe.
The SSR indicator only goes back to late 2018, so it has not yet lived through a full cycle. In addition, the indicator doesn’t take into account derivates and cash, and is only looking at stablecoins. However, as time goes on, the use of stablecoins is increasing rapidly so this indicator should become more important.
Plan
I continue to view DCA-ing Bitcoin as the optimal strategy and have continued to nibble at Bitcoin whilst also keeping back a stack of cash, just in case we see a capitulation crash.
For now I am completely avoiding altcoins until we either get capitulation crash, or Bitcoin has clearly resumed the start of its next uptrend.
News Highlights
Terra Backing Their Stablecoin With Bitcoin

Huge news from Terra basically announcing they will be buying more Bitcoin than MicroStrategy and Tesla combined, to build up a reserve to back their stablecoin… To learn more, Anthony Pompliano wrote a good piece on it:

Exxon Mobil Moves Into Bitcoin Mining

Exxon Mobil will be using the excess gas produced from oil wells to mine Bitcoin. This is a big positive both for Bitcoin and the environment. This gas is usually burned in a process called flaring. Why? Because they don’t have the infrastructure to store and transport the gas due to either political or financial reasons, and directly venting the gas as methane is far worse for the environment than burning it into CO2.

The problem is that this process still has excess waste from incomplete combustion. Now with Bitcoin mining, the energy companies are incentivised to actually use this gas properly which produces less waste than simply flaring it. In addition, it adds to the security of the Bitcoin network, increasing the defence of everyone’s property rights.

What I’ve Been Listening To
Luke Gromen’s Macro Thesis
For anyone slightly interested in Economics, this is an absolute must. The freezing of Russia’s foreign exchange reserves was likely as significant as Nixon taking the dollar off the gold standard, and Luke Gromen explains it all beautifully in his macro thesis.
The All-In Podcast
My biggest takeaway from this podcast was the second level effects on the food supply from Russian-Ukraine war. A food crisis is likely around the corner due to more reasons than are initially obvious, and I must confess we have been buying some extra pasta and rice recently…
What I’ve Been Watching
Jason Lowery On Bitcoin
Jason Lowery is part of a section of the US Space Force that researches into emerging technologies. He’s currently studying at MIT, to write a thesis on Bitcoin and Proof-of-Work. His way of viewing Bitcoin more as a defence network for any country or individual, more than a monetary one, is worth a listen.
What I’ve Been Reading
Prisoners of Geography by Tim Marshall

Started reading this book just after the Russian invasion and it’s crazy how much it foreshadows what is currently going on. The book dives into all the geographical aspects that affects a nations decisions, and it really shows why Ukraine is so important to Putin and why Ukraine joining NATO is such a threat to him.
Eye-opening and easy to read.
Quote I’m Pondering
'And here is a parable of life for you to ponder on: A group of tourists sits in a bus that is passing though gorgeously beautiful country; lakes and mountains and green fields and rivers. But the shades of the bus are pulled down. They do not have the slightest idea of what lies beyond the windows of the bus and all the time of their journey is spent in squabbling over who will have the seat of honour in the bus, who will be applauded, who will be well considered. And so they remain till journey’s end.’ - Anthony de Mello
Stay safe, keep studying, and don’t forget to take a breather and look around you.
All the best,
Tats