
The Great Storm

A great magician stands inside a castle in the middle of the sea. The air inside crackles with energy as the magician slices the air with his fingers, a low deep muttering coming out from under his breath. 11 hooded figures surround the man, holding hands as they gently sway, humming in unison to create a harmonious cradle for the magician’s incantations. A storm rages outside and clouds as dark as the deepest shadows of the night, race across the sky, thunder bellowing from all around. Bolts of lightning dart down from the heavens and reveal a fleet of ships in the distance, battling with the forces of nature as they try to maintain price stability and maximum employment. A ship called the Bank of England, has had her hull breached, but managed to fix it up before too much damage was done. Andrew Baily, the ships head magician, shouts into the wind, begging for those in the castle to end their spells, but to no avail. The winds are too strong, and the magician of the castle too focused up on his task on bringing down inflation. This is no normal storm. This is tragic magic.
This is not too far from where we find ourselves today. Although it has been a while since my last publication, the macro backdrop remains the same; inflation remains sticky and the Fed is orchestrating an L-shaped recession to reduce consumer demand and increase unemployment, to try and bring down inflation. The only difference today, is that we are starting to see some things break.

Japan had to perform their first currency intervention in over two decades to stop the yen falling, the British pound had its biggest single-day move in history in response to Lizzie’s mini budget, the Bank of England had to temporarily resume the money printer (QE) to purchase long-duration UK government bonds despite 10% inflation, and bond yields across the developed world, including the US, are having unusually volatile moves to the upside due to the lack of buyers.
I’m going to briefly touch on Japan and then dive into the England debacle as it could be a warning signal of things to come.

Japan is a net importer of energy and is having to pay higher prices for liquified natural gas since it has to compete with Europe’s purchases. This has led to them running both a budget and trade deficit, also called a twin deficit. This means they are importing more than they export, due to the higher costs of energy, and the government is spending more than their income. The only way to pay for the budget deficit is through the issuance of more debt. With Japan’s government debt to GDP ratio currently sitting at 250% (the highest in the world), the Bank of Japan is keeping short term rates at -0.1% and have committed to capping 10-year government bond yields at 0.25%. Lower bond prices, means higher bond yields, so they are capping yields by buying an infinite number of bonds to prop up the price, and hence keep the rate low. This is called yield curve control. The price paid for this is the value of the currency. As rates of every other country increase, the Japanese yen becomes less and less attractive.

After a year of brutal devaluation, Japan spent $19.7 billion dollars to try and prop up the yen in the foreign exchange markets. They hold $135.5 billion worth of deposits parked with foreign central banks and the Bank for International Settlements (BIS), which they can tap into, to sell the dollar and buy the yen. However, if that runs out, they will have to rely on selling other assets like US treasuries, of which they are the largest holder in the world.
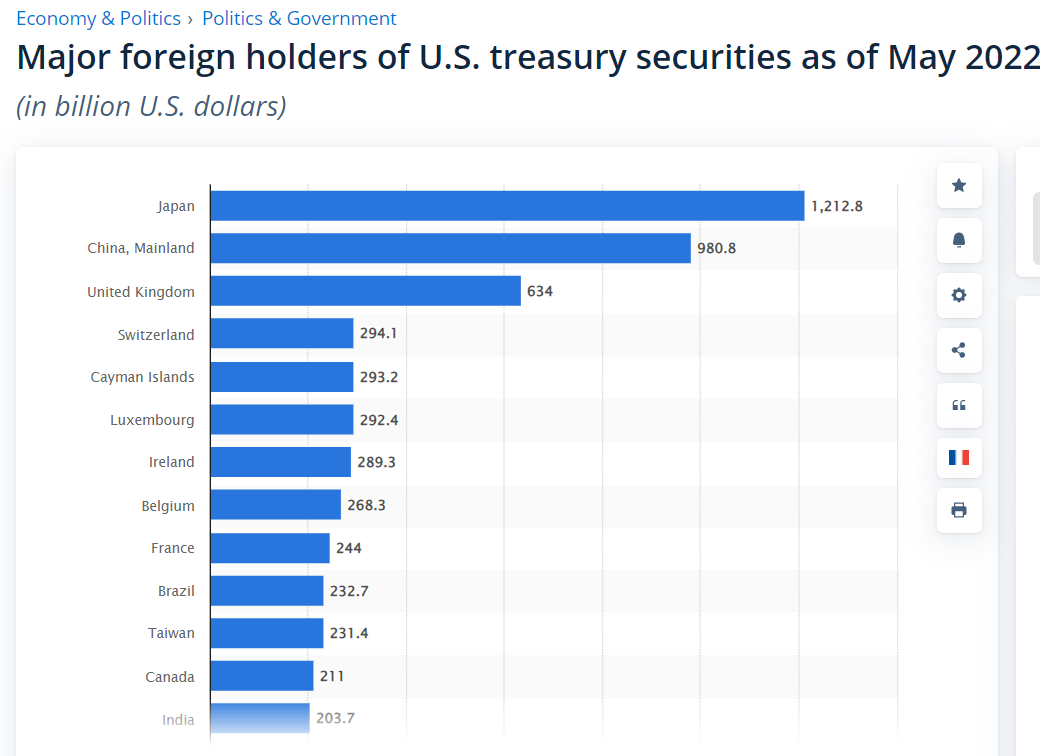
China has stopped buying and is slowly selling treasuries, and as we will see, the UK is in no state to buy treasuries. If Japan were forced to sell their treasuries, it would make matters much worse for the US government bond market, which is already having some monumental sell offs, and would be one of the factors that would force the hand of the Fed to step in and buy government debt once more.
Now onto ‘Great’ Britain.
Like Japan, the UK is also running a twin deficit, except it’s not due to a recent spike in energy costs, they’ve been running a growing deficit for the last few decades, similar to the US.

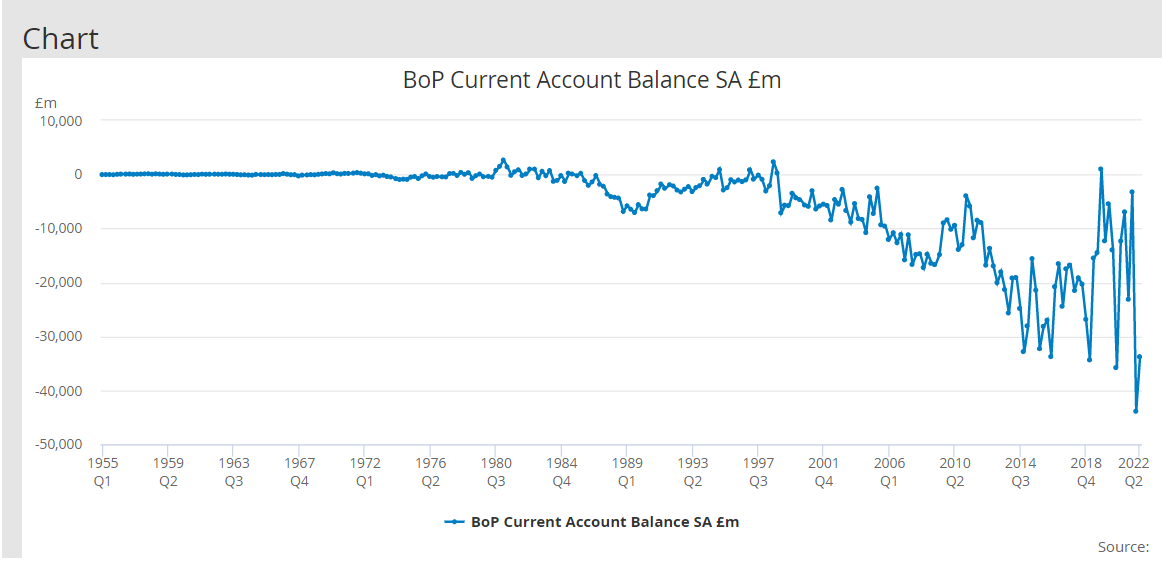
This is all well and good in a disinflationary environment, as you can keep lowering interest rates, which keeps the cost of servicing the ever-growing debt low. However, as we now face the highest inflation since the 70s, the trend of ever lower interest rates has come to an end, and with that comes a reckoning for those who have relied too much on the issuance of debt to finance their spendings.
The Bank of England is trying to fight inflation by raising interest rates and performing quantitative tightening (QT) - the opposite to quantitative easing. However, 9 months into their QT plan, they’ve had to reverse course due to disfunction in the bond market.
The British pound and bonds have been falling for the last 1-2 years. However, the recent bonds market capitulation was also partly a reaction to the announcement of Liz Truss’s mini-fudged it. Her proposal of debt funded tax cuts makes matters for the budget deficit worse because she’s looking to lower the governments income - tax cuts - and pay for it by issuing even more debt, at a time when issuing debt is becoming more expensive due to rising interest rates. The part which makes the least amount of sense is that she’s trying to ‘boost’ the economy through tax cuts, which is in complete disaccord to The Bank of England who is raising interest rates to try and slow the economy in order to tackle inflation. The markets reacted by selling both the pound and government bonds aggressively, which led to many pension funds getting margin called, meaning they have to post more collateral (money) to avoid getting completely liquidated in their trade positions.

UK pension funds collective assets are worth more than 100% of UK’s GDP, so if they crash, in addition to wiping out the pensioners, it brings down the whole UK financial system, including the UK government bond market. All pension funds have similar portfolios in that they all have a lot of exposure to long-duration government bonds. Therefore, if one of them gets margin called and is forced to sell some of their bonds, this pushes the price of bonds down further, leading to more pension funds getting margin called, leading to a truly catastrophic cascade of financial dominoes.

To stop this chaos, The Bank of England had to step in and stop the crash in bond prices, by buying as many as is needed to stabilise the market. A huge hit to their credibility given they are meant to be doing the opposite.
Here’s the key part of their statement:
'“As the Governor said in his statement on Monday, the Bank is monitoring developments in financial markets very closely in light of the significant repricing of UK and global financial assets.
This repricing has become more significant in the past day – and it is particularly affecting long-dated UK government debt. Were dysfunction in this market to continue or worsen, there would be a material risk to UK financial stability. This would lead to an unwarranted tightening of financing conditions and a reduction of the flow of credit to the real economy.
In line with its financial stability objective, the Bank of England stands ready to restore market functioning and reduce any risks from contagion to credit conditions for UK households and businesses.
To achieve this, the Bank will carry out temporary purchases of long-dated UK government bonds from 28 September. The purpose of these purchases will be to restore orderly market conditions. The purchases will be carried out on whatever scale is necessary to effect this outcome. The operation will be fully indemnified by HM Treasury.”
This is a clear example of something that can ‘break’, forcing the hand of the central bank to resume QE, even with inflation at 40-year highs. At the end of the day, the central bank is an extension of the government and during times of crises, be it war, covid, or in this case a financial crisis, they have no choice but to step in and buy government debt.
This is unlikely to be the last shoe to drop in this hiking cycle and could be a sign of things to come in Europe and eventually the US.


Bitcoin Update
Given this macro backdrop, you will be unsurprised to hear that not much has changed in the world of Bitcoin. We remain almost exactly where we were in the last newsletter, as price has stabilised around the 2017 high at $20k.

Something to note, is that so far, this bear market has been remarkably similar to the last 2, as can be seen below. If this pattern continues to play out, then it would likely lead to a dip into the green region, seen above, before making a final bottom.
The last two bear markets can be seen in orange and red, and the current bear market is in green.
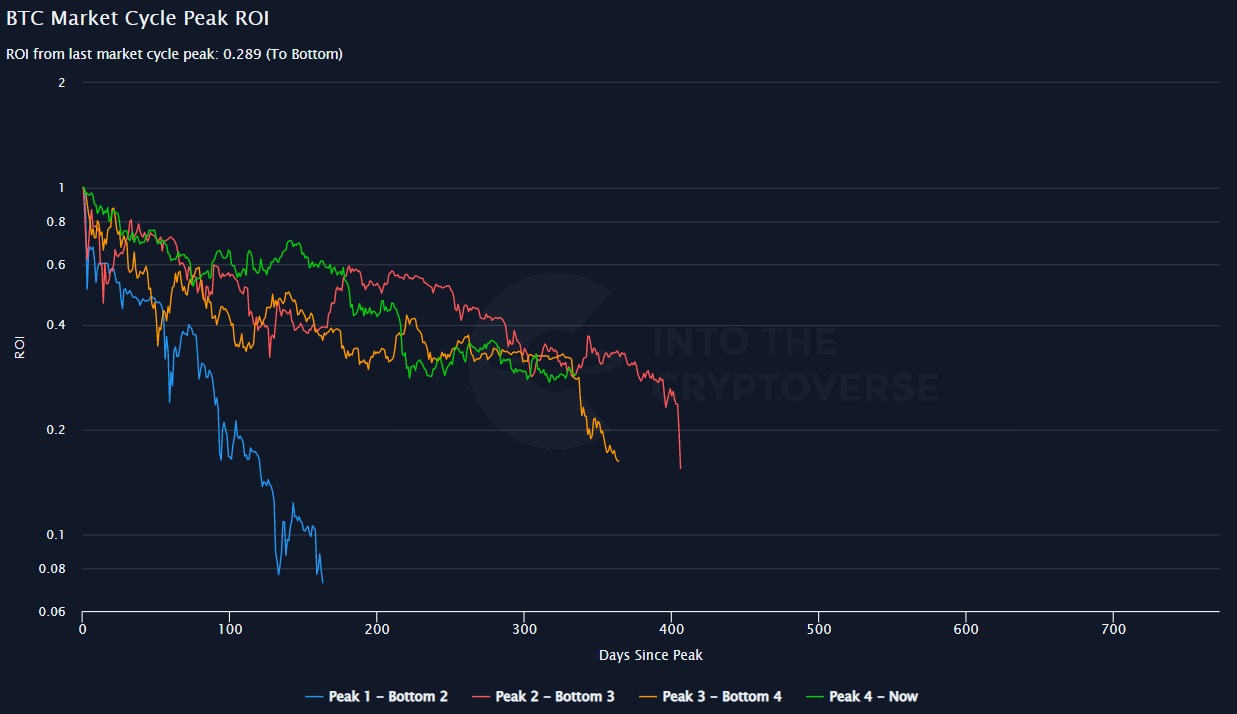
If you’re wondering what happened after the final capitulation, price just went sideways for at least the next 3 months.

And after that… well the rest is history.

Whether this continues to play out is of course unknown. However, given the magnitude of the stress in the global economy, this scenario should not be ignored, whether it means we must go sideways for longer, or whether the capitulation is worse is.
One Chart That is On the Rise
In an environment when every single metric in crypto seems to be trending down, one chart which continues to rise aggressively is the Bitcoin Lightning Network capacity. The Lightning Network is a layer built on top of Bitcoin that allows for super-fast and cheap transactions. It is still small, but the fact that it continues to grow, even in this environment, is something to note.
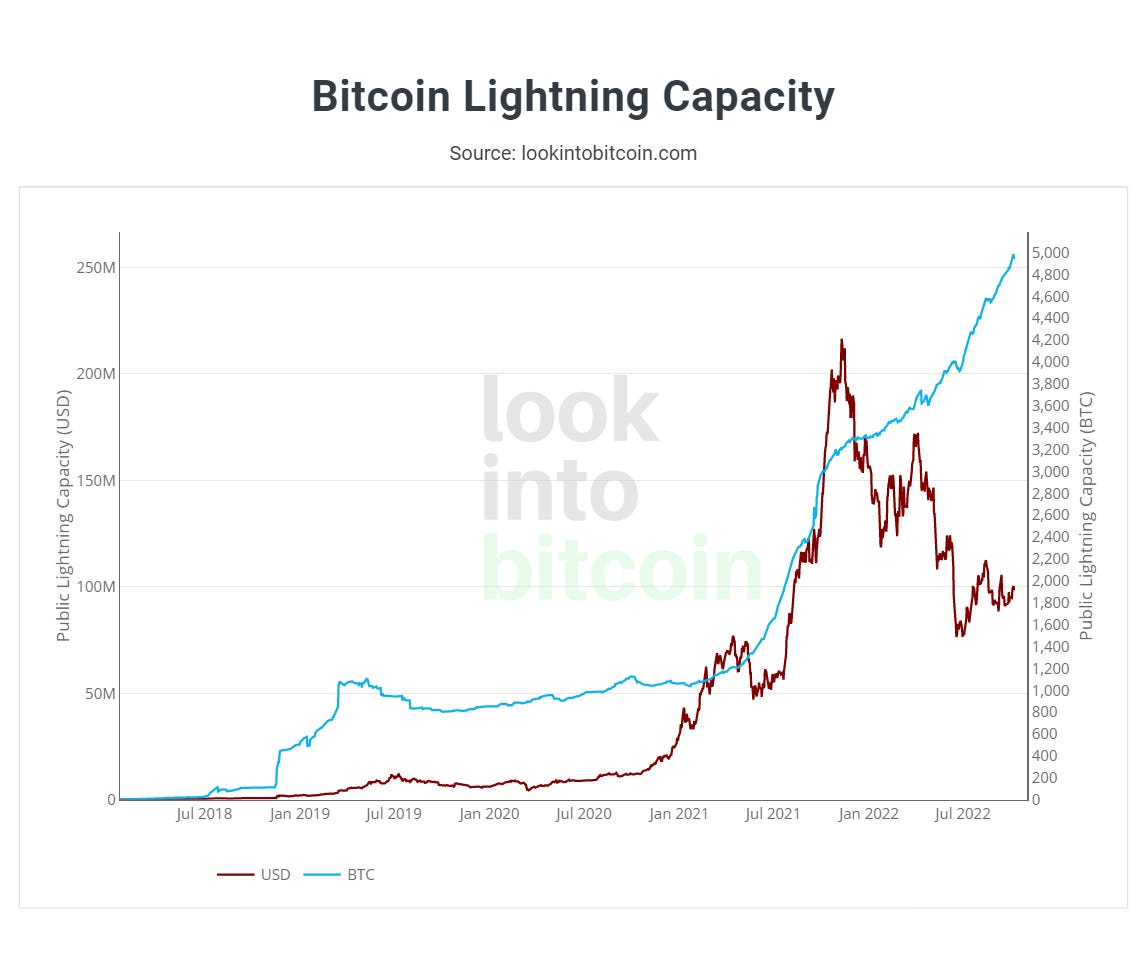
I recommend reading Lyn Alden’s Lightning Report to learn more about it.
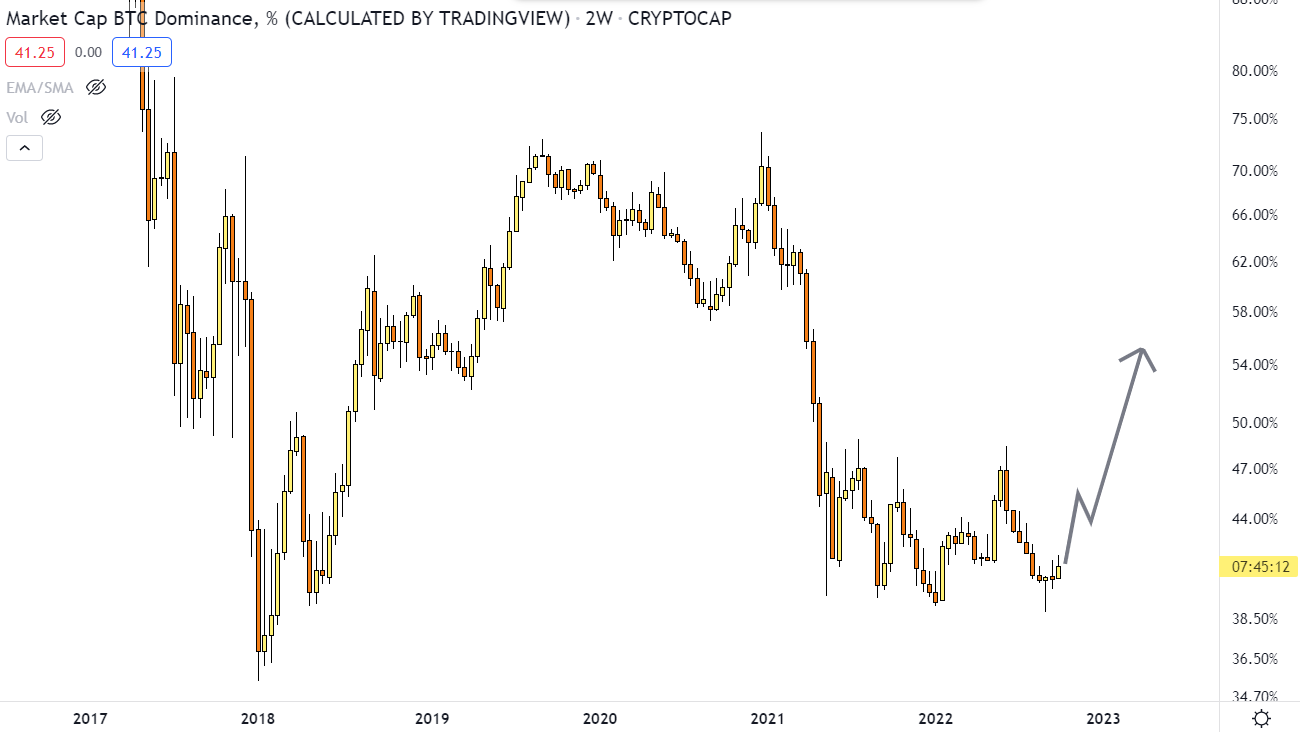
The Rest of Crypto
With regard to the rest of crypto, I expect altcoins to underperform Bitcoin as this bear market continues. We are in a risk-off environment and as such, the path of least resistance seems to be upwards for the Bitcoin dominance. As such, any DCA’s I currently make, are strictly into Bitcoin.
Are We There Yet?
The game of waiting for the bottom is not so dissimilar to times when you were a kid asking your parents if we are nearly there every 5 minutes. It is a game of probabilities which can seem to have no end. However, there are two clear milestones that if reached can give a more definitive answer.
The first is that bottoming indicators are at over-sold readings and signalling a bottom. The second milestone is when the fed stops hiking interest rates. The first is your early signal, telling you that the bottom is near, the second is your confirmation.
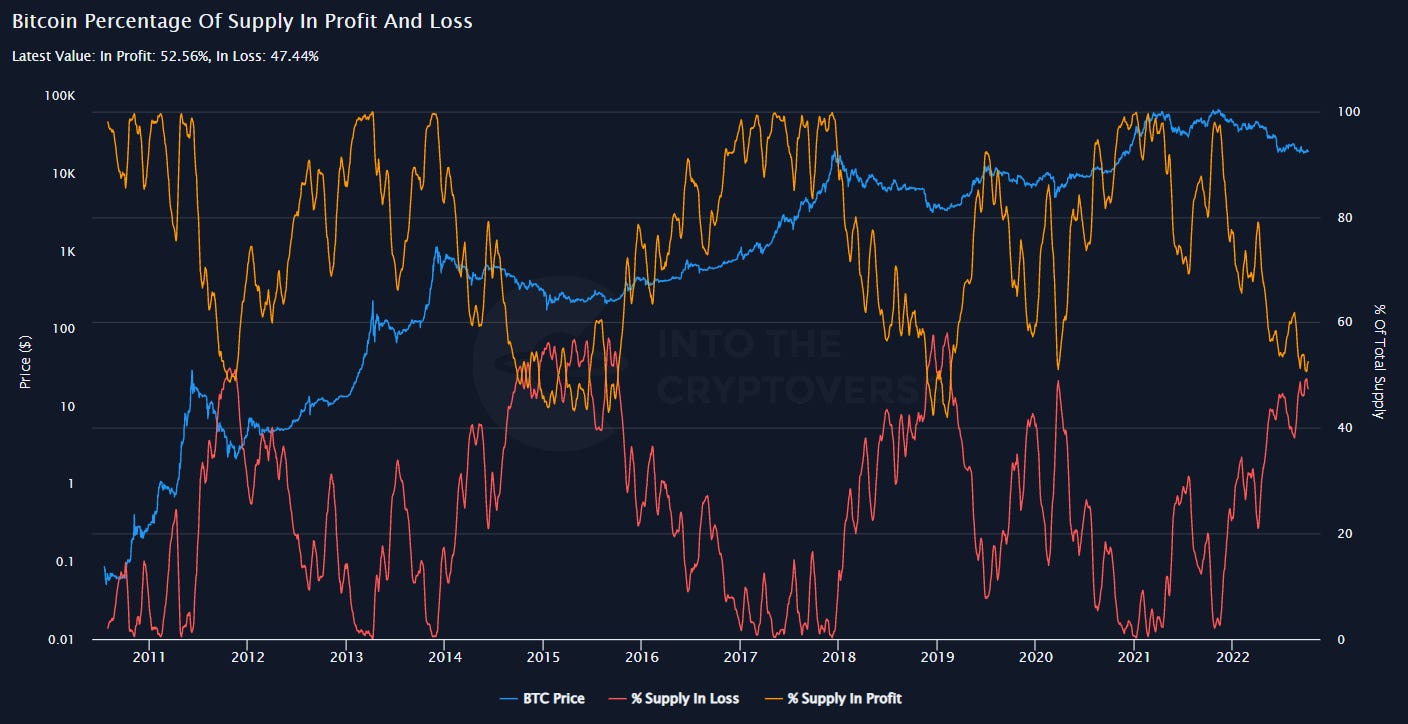
For an update on the bottoming indicators, the only change is that the hash ribbons signal has finally flashed, and the supply in profit and loss is getting close to crossing. Other indicators like the MVRV Z-score are also where previous bottoms have occurred, but still have a bit of room to fall further. Essentially, we could be there, but if things get worse with the macro, there is still room to fall further given what has occurred during previous bear markets.
White dotted line is the signal, and I’ve highlighted all the ones that have followed a bear market in green boxes.

Supply in profit and loss typically cross near the bottom of a bear market and are currently flirting with each other.
Market value to realised value (MVRV) z-score very near historical extreme lows.

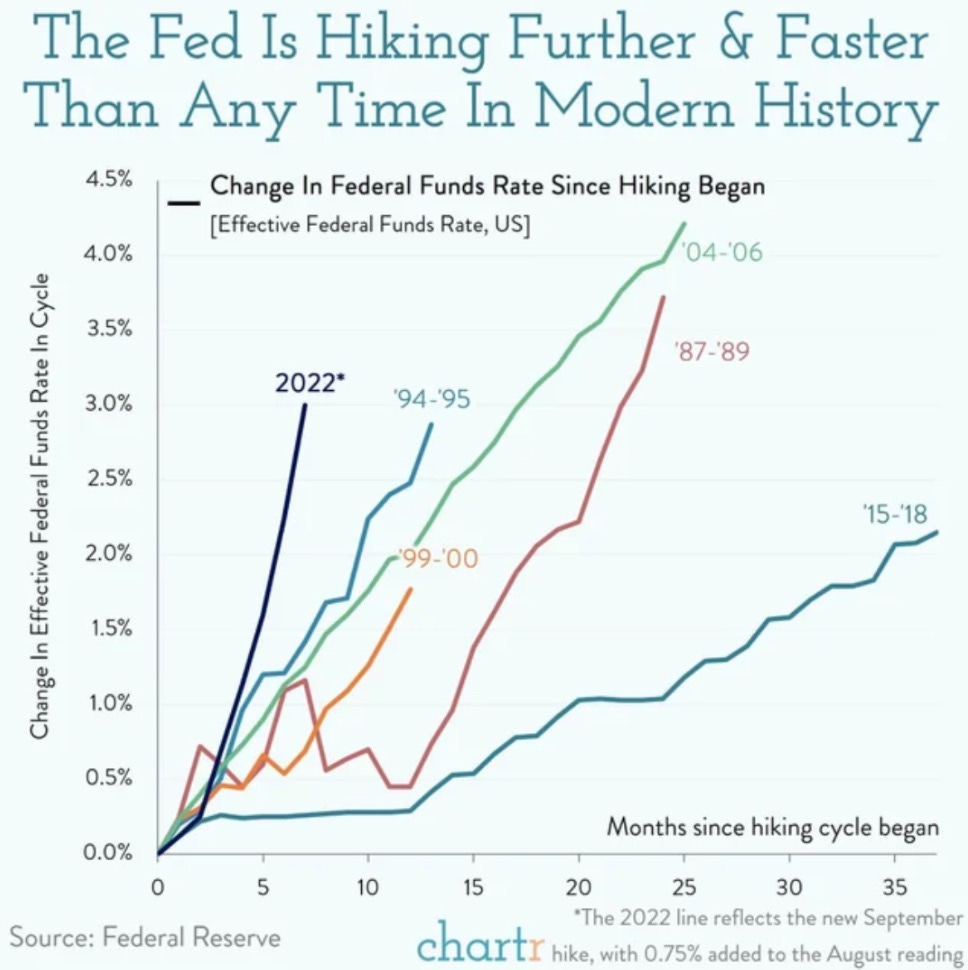
As for the second milestone, The Fed has certainly not stopped hiking yet. The Federal Reserve is raising interest rates at a truly historic rate and is performing Quantitative Tightening to drain liquidity from the system, to try and tame inflation.
A good analogy from the point of view of assets is that of a swimming pool. The water inside the swimming pool represents dollars in the financial system and the fed is currently draining the pool via a hole in the bottom. Until the pool stops being drained, the dollar is king.


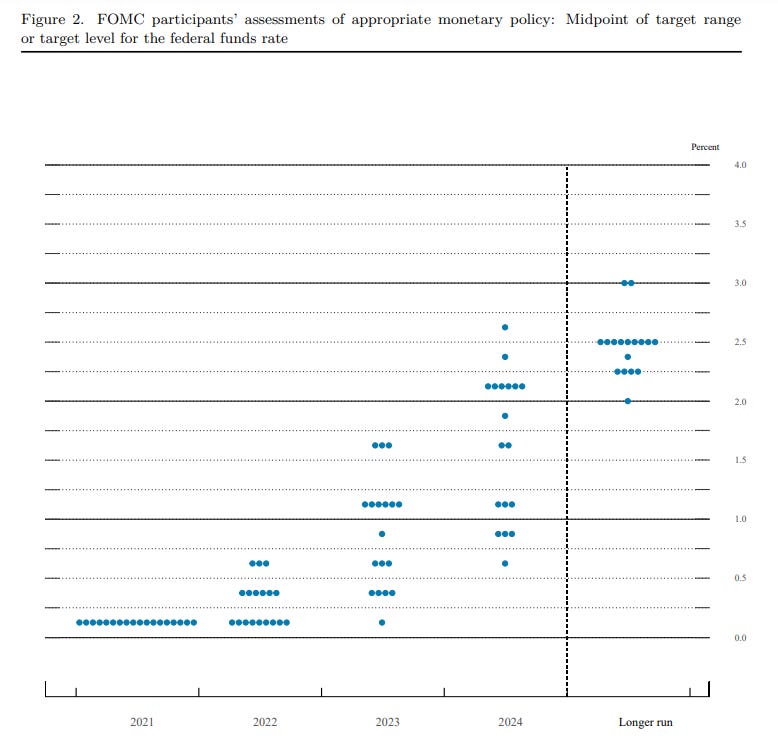
When will the Fed pivot? According to their latest ‘dot-plot’ sometime in 2023. However, this has historically not been great at predicting what the fed will actually do, due to the fact that things change and don’t necessarily go the way they think it will.
The Fed’s dot plot is a chart that records each Fed official’s projection for the central bank’s key short-term interest rate. The dots reflect what each U.S. central banker thinks will be the appropriate midpoint of the feds interest rate at the end of each calendar year

If we look at their dot plot from a year ago, we can see how different it looks to the one today. They expected 2022 interest rates to be between 0 and 0.75% and it is currently 3.25% and the year is not yet over.
However, their intentions are clear. They intend to keep hiking until inflation falls considerably and/or unemployment increases significantly, or there is dysfunction in the treasury market, like what we saw in the UK. If neither of those things occur, the Fed will keep hiking until they do. As we go into the end of the year and early 2023, disorder in the treasury market is likely to increase as the Treasury is planning to issue more debt around that time, and with no buyers currently present, they could be faced with some liquidity issues that could force the hand of the fed. But for now, we await the second confirmation signal.
I still view dollar cost averaging into Bitcoin as the best way to get exposure to the asset, whilst keeping back a stack of cash to take advantage of another capitulation.
Bits and Bobs
Three Great Podcasts
The first explores how farmland can be a good addition to an investment portfolio. The second is all about the global macro with Daniel Di Martino, who is an expert on the Federal Reserve. And the third is about a guy who was coding neural networks by the end primary school and is now building some pretty cool things on Bitcoin.
Two Great Books
The first is one of the most insightful interesting books I’ve read in a very long time. It sounds very dry but is in fact quite the opposite. Given the current global environment, it seems even more important to understand the drivers behind one of the greatest global financial catastrophes in history.
The second is a new book published by the company I work for, which I think would be perfect for any beginner looking to understand Bitcoin better.


A Photo from My Daily Walk
When work is so concentrated around the laptop, it can be hard to remind yourself to get outside and have some time to clear your head. So, I have started doing a walk a day and have found myself to be sleeping better, having more ideas, and generally having a less muddled mind. To top it all off, the world can look pretty sxc.

Have a great day!
All the best,
Tatsuki
Library
Bullish - Causing, expecting, or characterized by rising stock market prices.
Bearish - Causing, expecting, or characterized by falling stock market prices.
Bear Trap - Tricking everyone that price is going to break down, before moving up.
Bull Trap - Tricking everyone that price is going to break up, before crashing down.
DCA - Dollar Cost Average. Investing incrementally on fixed schedule.
DEX - Decentralised exchange.
EMA - Exponential moving average
ETF - Exchange traded fund. A type of security that tracks an index, sector, commodity, or other asset, but which can be purchased or sold on a stock exchange the same way a regular stock can.
Fed - The Federal Reserve, central banking system of the US.
Fiat Currency - Fiat money is government-issued currency that is not backed by a physical commodity, such as gold or silver.
FOMC - The Federal Open Market Committee (FOMC) is the monetary policymaking body of the Federal Reserve System.
Fractal - Repeating patterns from the past.
HODL - To hold your coins and not sell them despite crashes in price.
MA - Moving average.
S/R - Support/Resistance level.
Stablecoin - A cryptocurrency pegged to a traditional fiat currency, like the dollar.
Whale - A very large holder of Bitcoin.
The information contained herein is for informational purposes only. Nothing herein shall be construed to be financial legal or tax advice. The content of this email is solely the opinions of the write who is not a licensed financial advisor or registered investment advisor. Trading cryptocurrencies poses considerable risk of loss. The writer does not guarantee any particular outcome.