
What Are Bitcoin Whales Doing? How Low Can We Go??
What Are Bitcoin Whales Doing? How Low Can We Go??

Hey Guys,
I want to start by saying well done to those of you who have messaged me about buying Bitcoin during the current downtrend we are experiencing. Everyone talks about buying the dip, but you would be amazed by the number of people who go quiet, when the price is low, and then come back asking how to buy Bitcoin once the price has shot up again. Stop following the herd and you will be rewarded.
This is an exciting time to get into crypto. Up until now, we have been floating around the middle of most indicators. Neither undervalued, nor over overvalued. Due to the recent crash, we are entering regions where price is undervalued. These are prices which will be looked back at, in years to come, as extremely good buying opportunities.
I say ‘entering’, because we can still fall further. Does this mean you should be buying now? It depends on your personality and situation. So, what should you be doing? Making a plan.
To help you, I’m going to walk you through my plan for the coming months.
I’m also going to look at a possible worst-case scenario for Bitcoin and take a deeper look at who is currently buying.
As always, if you find this of value, please share with friends using this lovely orange button:
And if you wish to subscribe, another lovely button:
Bitcoin Wallet Analysis
Ex Goldman Sachs CEO, Lloyd Blankfein, said something that really resonated with me in this clip. In a not-so-poetic way, he said, ‘I can’t predict the future, but I think it’s a big thing to be able to predict the present, like what is happening.’
I interpreted this as ‘stop trying to predict the future’. It’s a very hard thing to do and many will be wrong. Instead, focus on looking at the present and what is actually going on.
In last week’s newsletter we looked at the Bitcoin HODL waves to try and determine what long-term holders were doing and concluded that:
Right now, we are at the peak of a recent accumulation phase. This doesn’t mean we can’t go lower; it means that with a 2-5 year view in mind, it’s an attractive time to DCA.
It also shows us that it wouldn’t be surprising for Bitcoin to continue sideways for some time as well. - After huge selling by long-term holders (back in May), it takes a while for Bitcoin to build out a new base before beginning its next run up.
This week I want to show you the behaviour patterns of investors, based on the size of their wallets (number of coins they hold). We can do this by looking at percentage of supply held by different sized wallets.
Let’s start by looking at supply held by smaller wallets, wallets which contain 0.001 - 0.01BTC (about $37-$370):
Bitcoin price is in blue. Supply count is in pink.
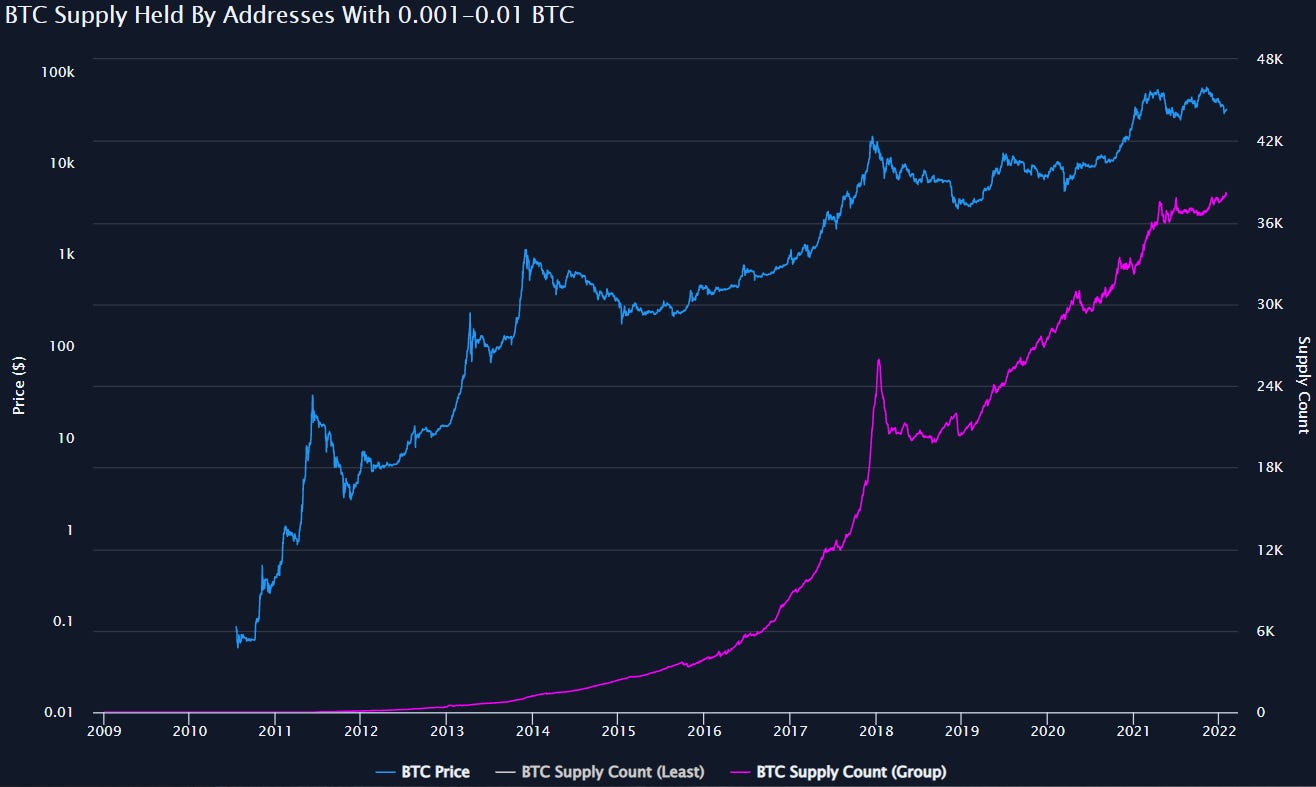
The overall trend is up, meaning the smaller wallets keep accumulating Bitcoin with time. However, this doesn’t tell us much, so I want to zoom in to focus on 2017 till now.

We can see the euphoria at the end of 2017 cycle and that the peak in supply held by these wallets came after the blow off top - They bought the top and panic sold shortly after as price came crashing down.
These wallets are almost like a lagging indicator - It confirms the crash has happened after it has already happened. It doesn’t predict.
It then took about 21 months (1.75 years) for the supply held by these to make a new high. The 2017 crash really freaked these guys out and it took a long time for them to start buying again.
Interestingly, once the buying resumed, we have a clear strong uptrend with very little panic selling, even after the May crash:
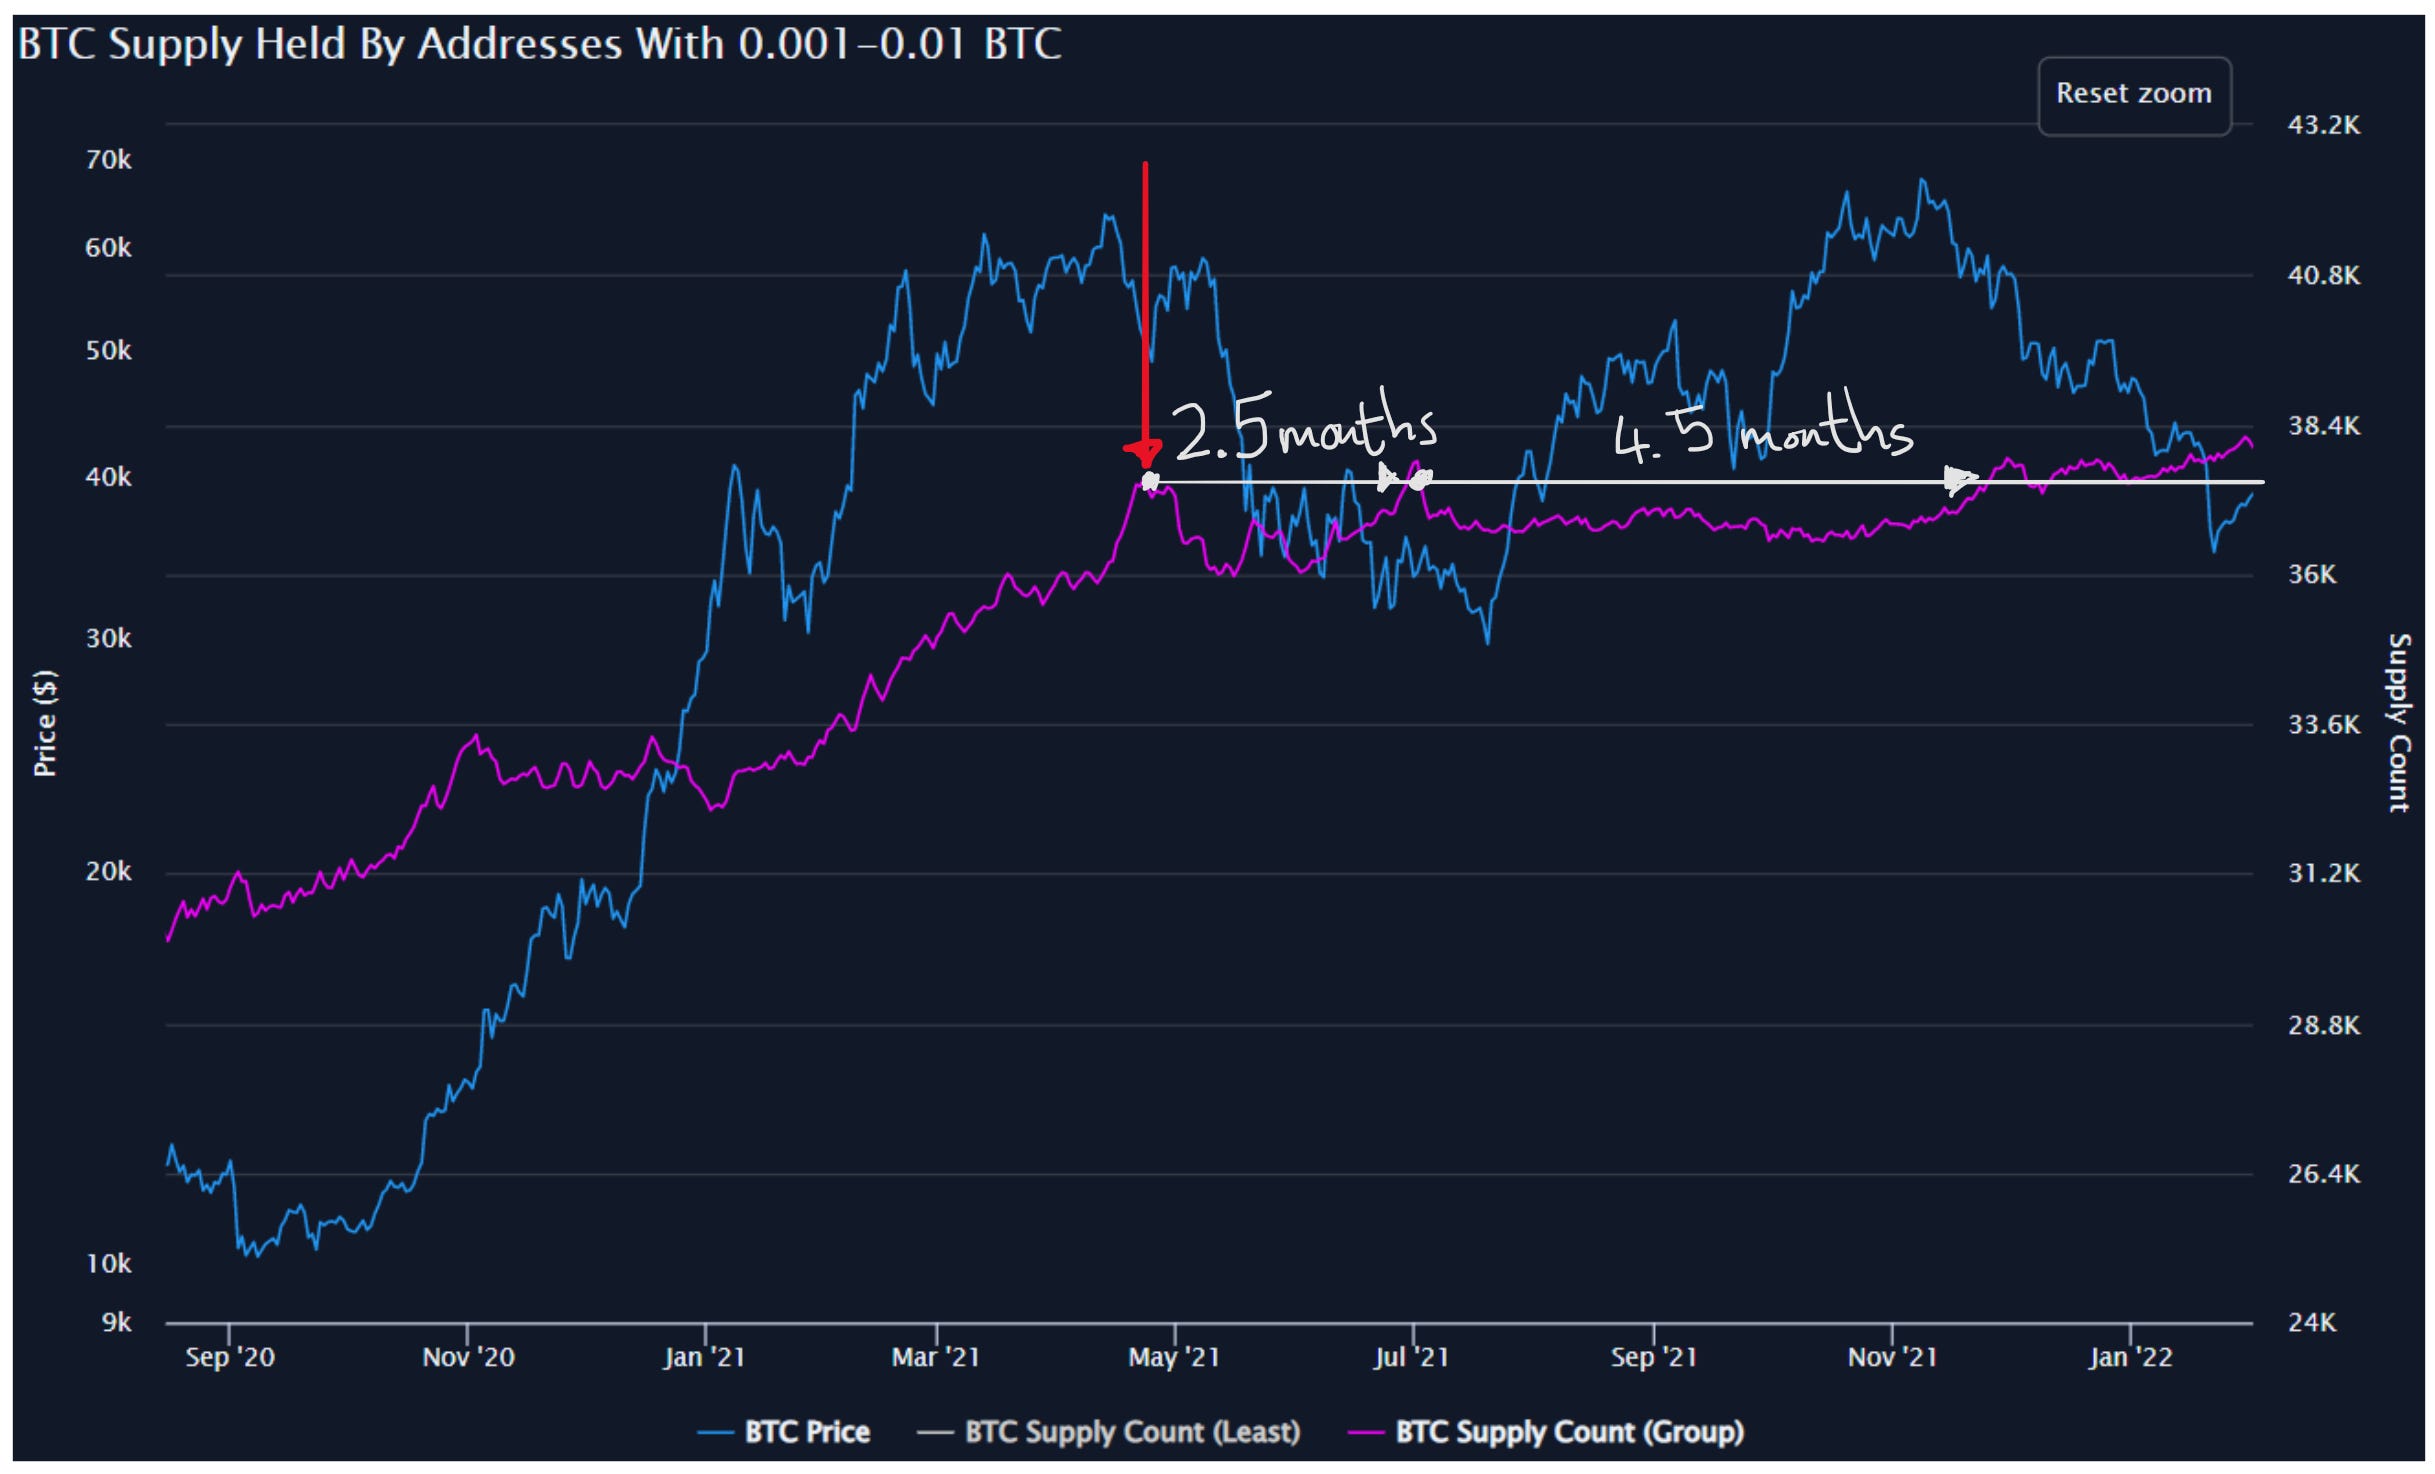
Once again, these guys bought the top and sold slightly too late, except this time they sold very little. It took only 2.5 months to make a new high and then another 4.5 months to sustainably stay above that level. - Much shorter than 21 months.
This could be due to an increased conviction in Bitcoin from these retail investors, so they just keep DCA-ing no matter what the price.
Now let’s look at the smarter money and study the whales. Whales are typically those that hold 1k or more BTC, so I am going to look at wallets which hold 1k-10k BTC:
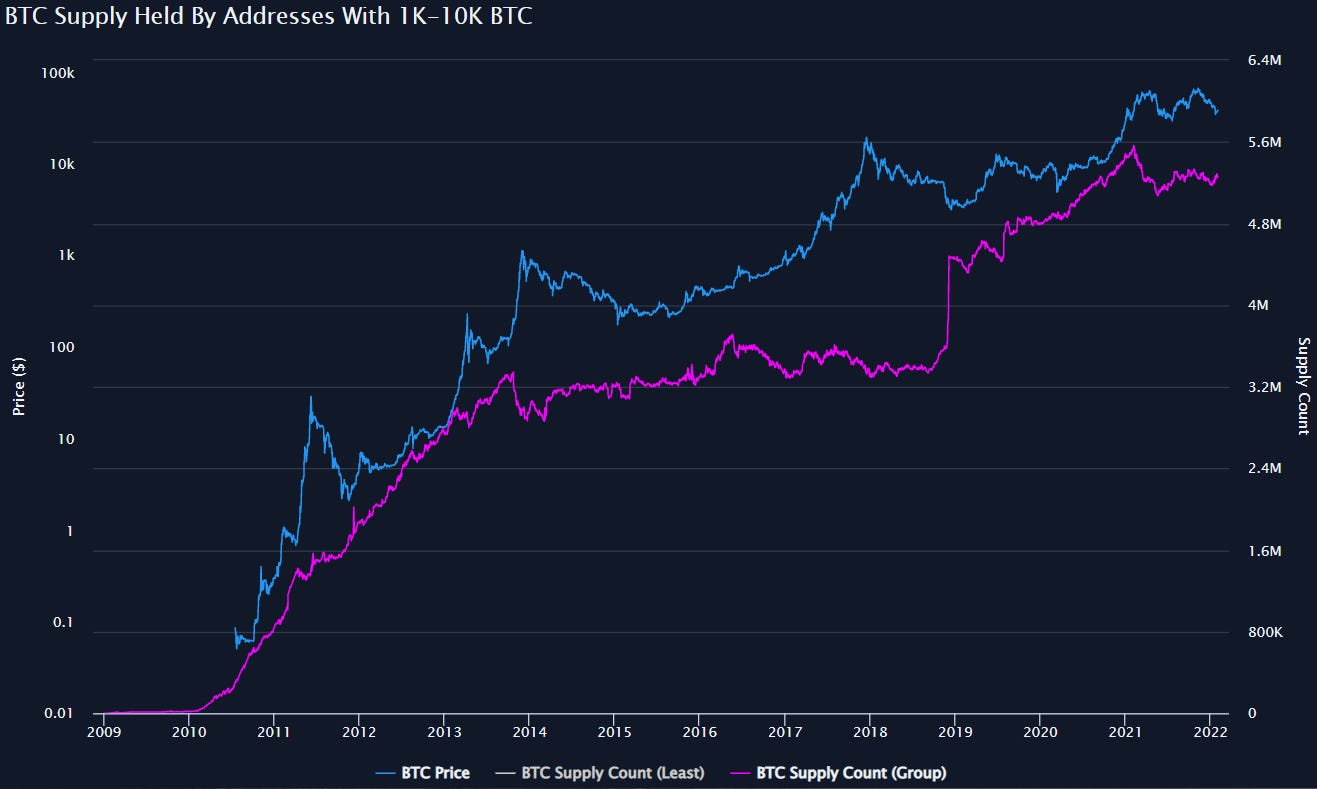
This is a slightly slower uptrend and once again I’m going to zoom in slightly, first to the 2013 cycle to examine their trading behaviours more closely. It should be noted that these wallets were worth around $100k - $10M back then. This is much less than what they are worth today, however, back then Bitcoin was an extremely new and speculative asset.
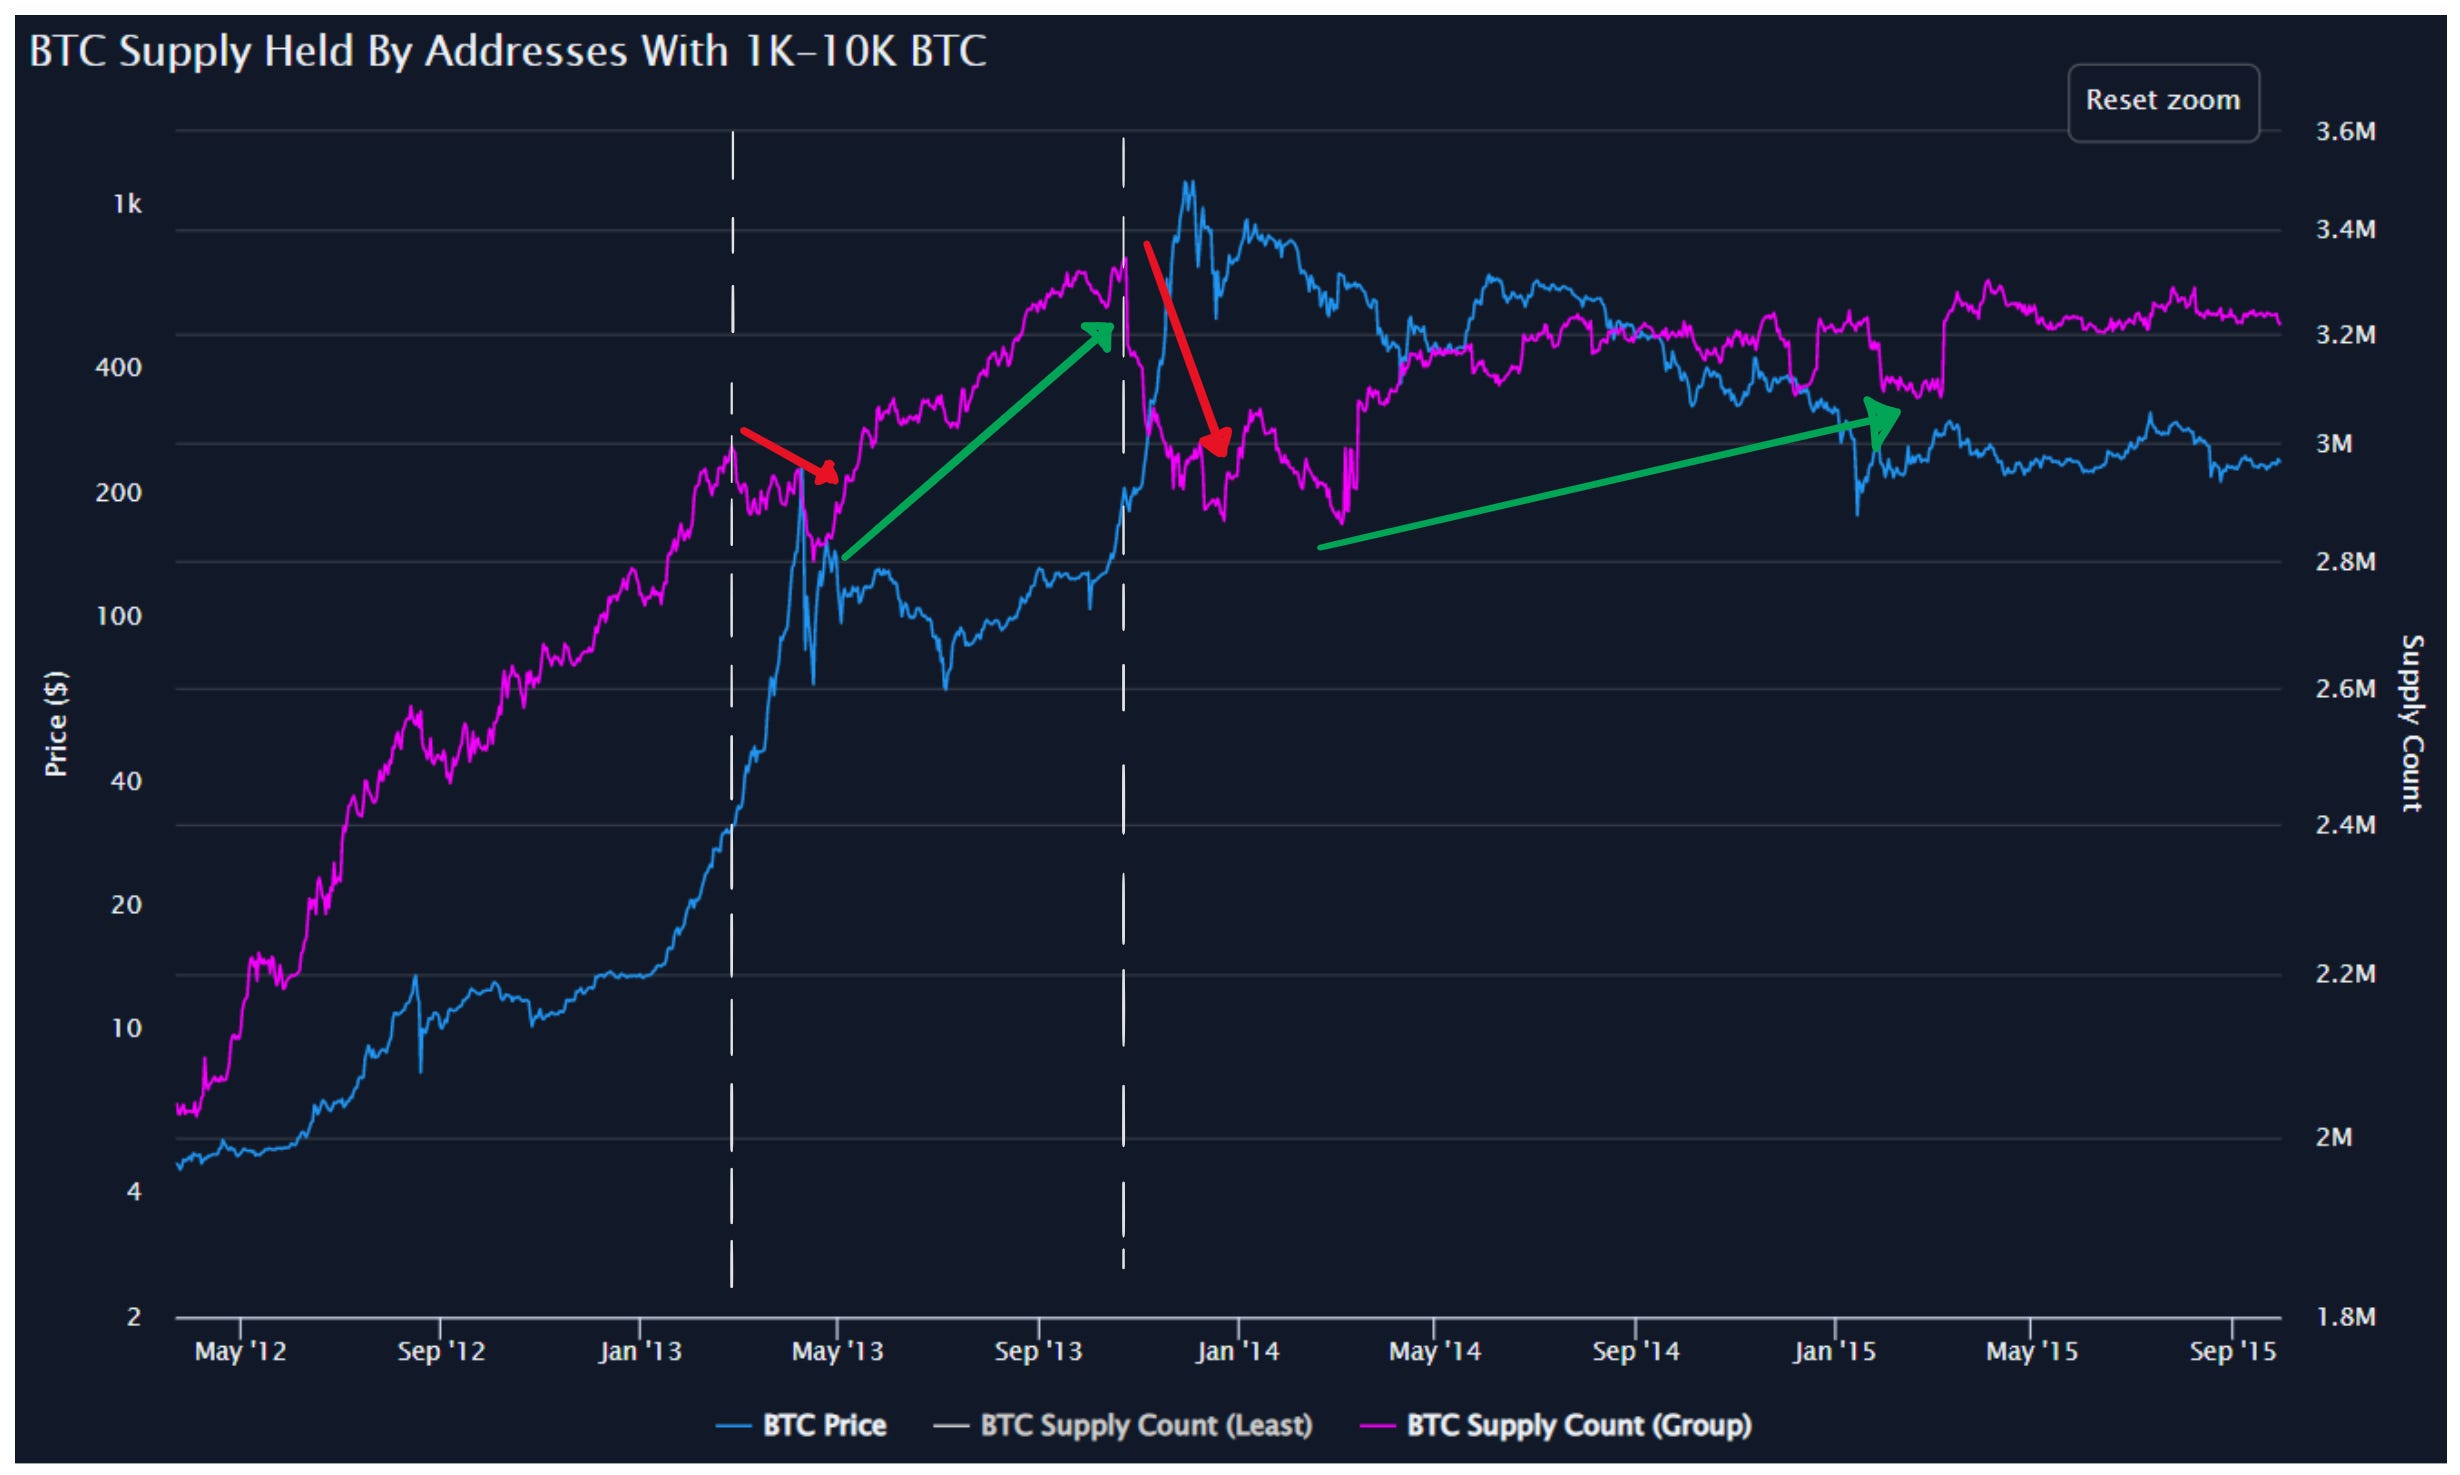
Despite the lack of historical market data, these wallets still managed to start selling before both peaks. What I find most impressive, is that after taking some profits before the first peak, they accumulated hard for the final run and once again sold the top. - Smart money.
The 2017 cycle paints a less clear picture. It almost seems as though they were expecting a repeat of 2013 (a double peak cycle), prematurely selling early in the run up, followed by a short burst buying, before selling the peak.
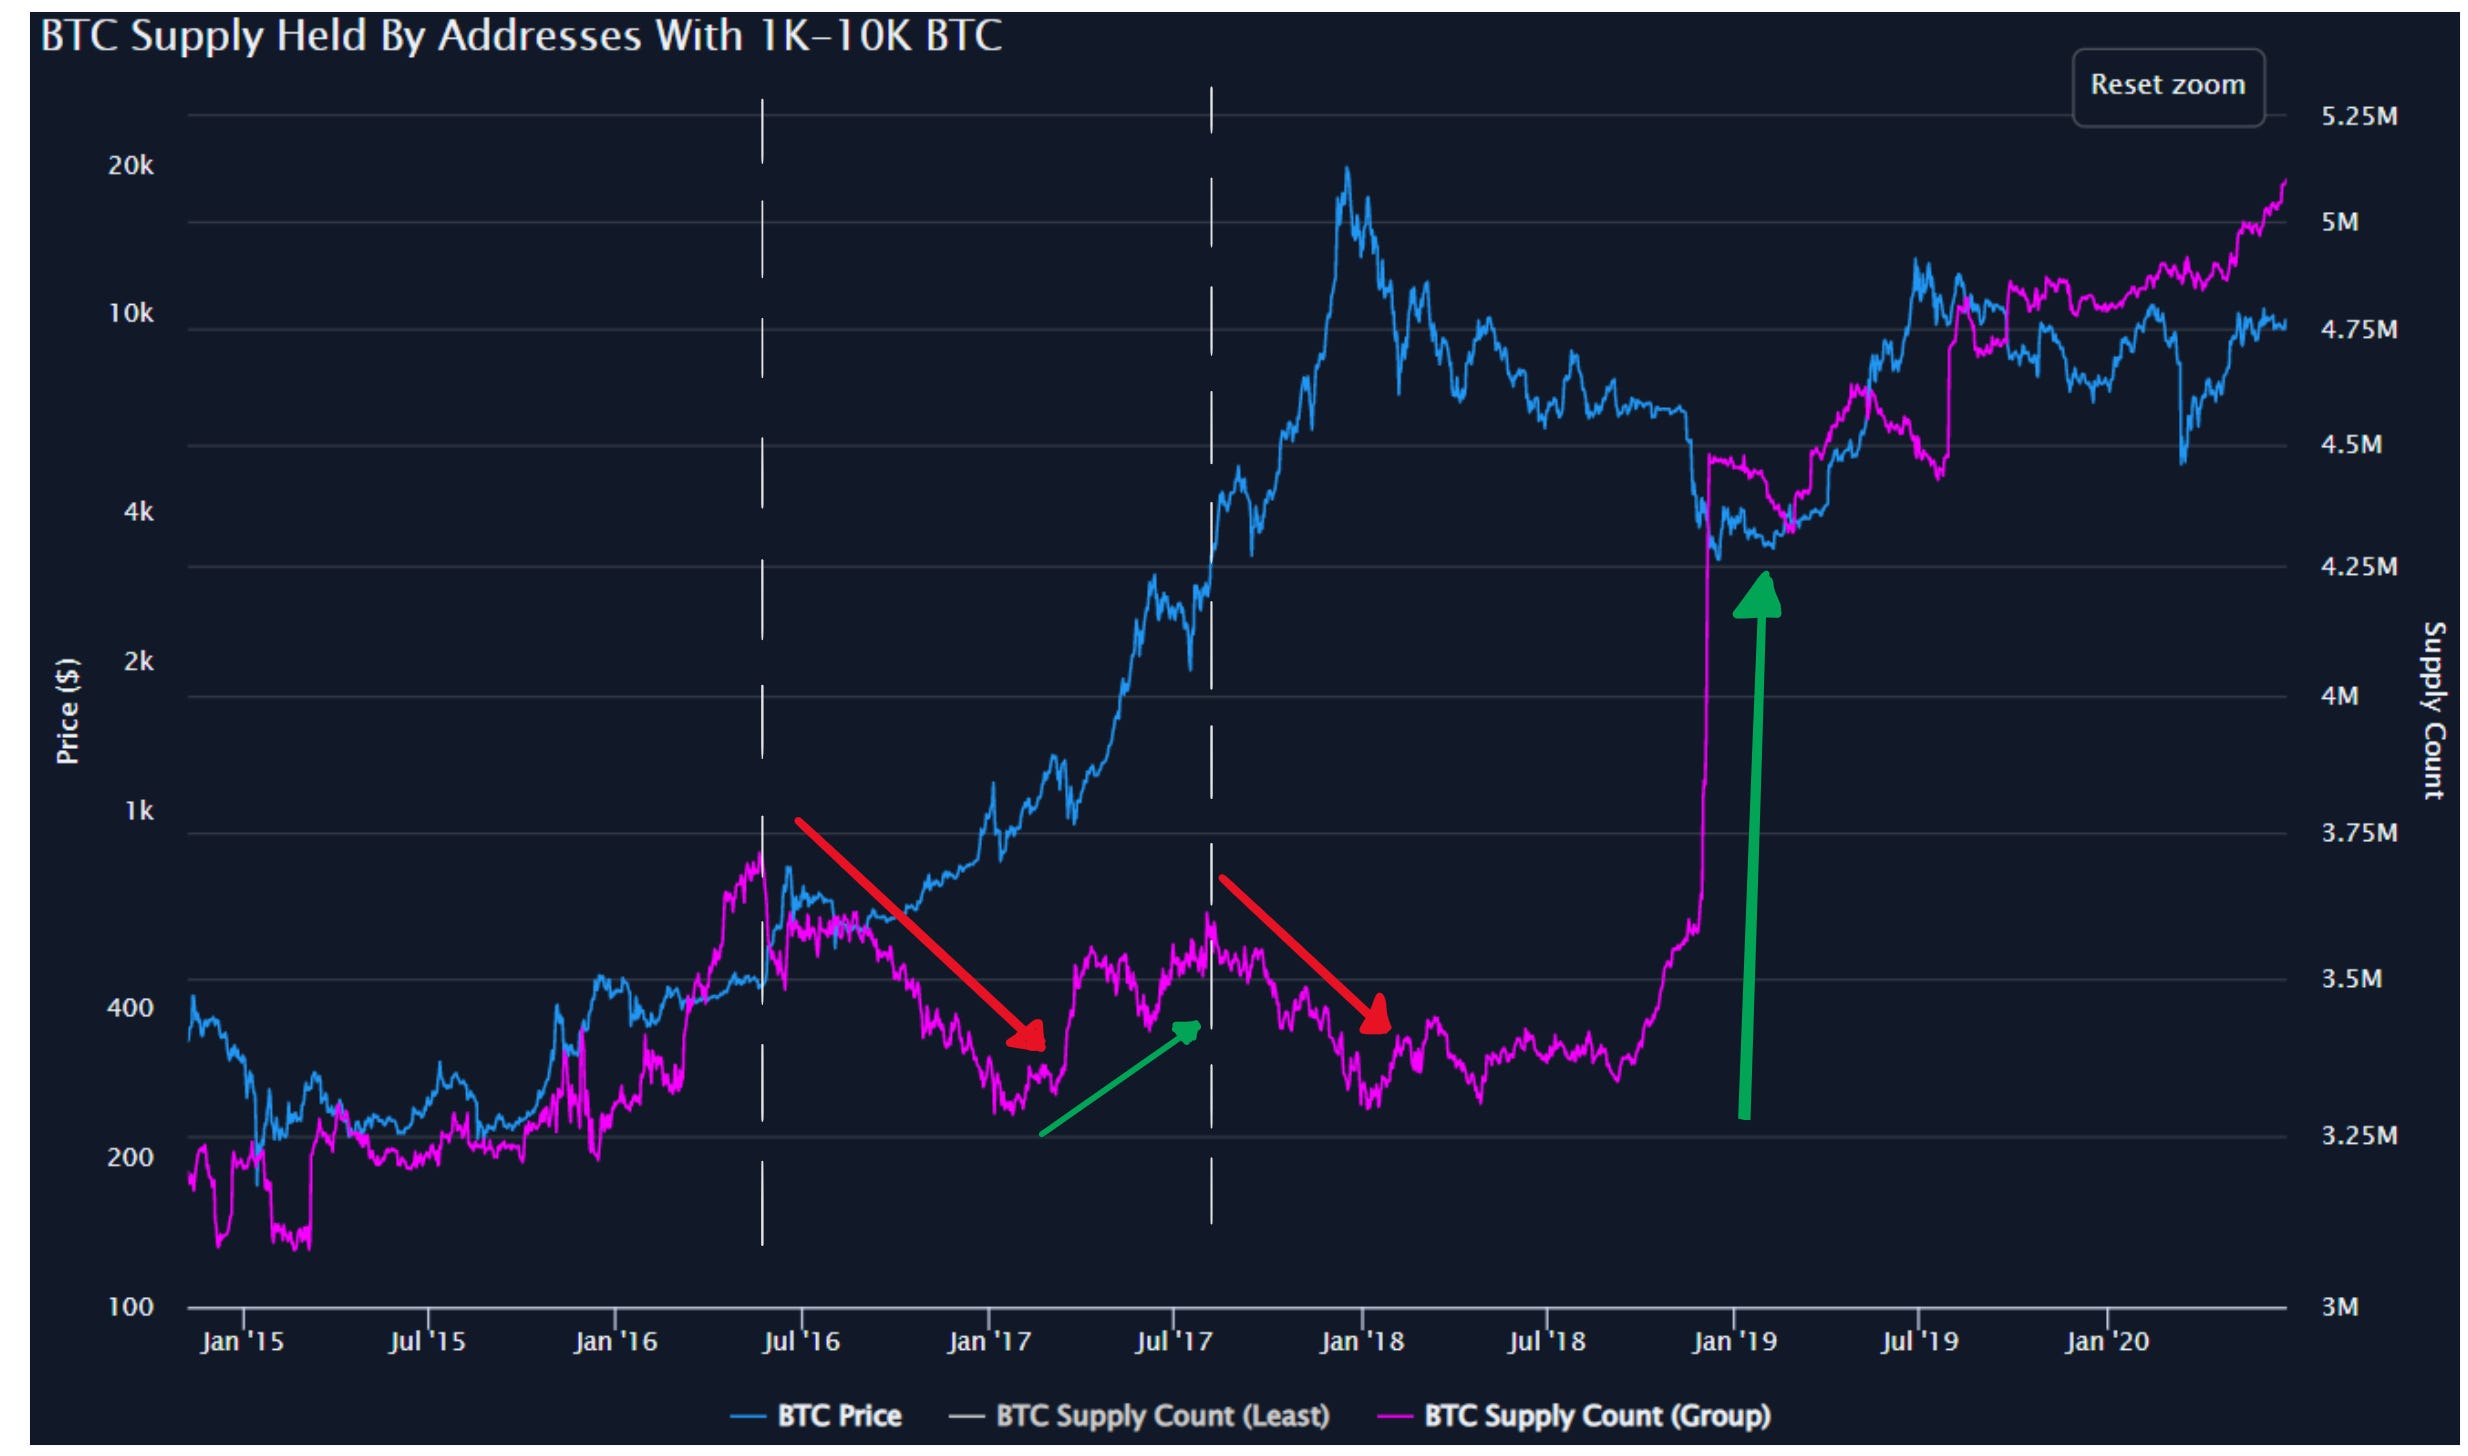
What is most notable is the immense buying that occurred, perfectly at the cycle bottom. Before the final sell off, they had already started buying and when the crash occurred, they piled in at a magnitude not yet seen before. These wallets were now worth around $4M - $40M. This could have been the entrance of the institutions.
Following the huge levels of buying at the 2017 bottom, Bitcoin went up 4x and these wallets took some profits in the run up. This was followed by another huge accumulation as Bitcoin crashed back down and eventually did a 10x from its March 2020 lows. Once again, they sold the top almost perfectly.
I want to point out that investors at this time had to see price decline 72% before being rewarded by the big run up to 63k. Investing in Bitcoin isn’t easy, but if you can sit through the drops and DCA, there’s a high probability you will do well.
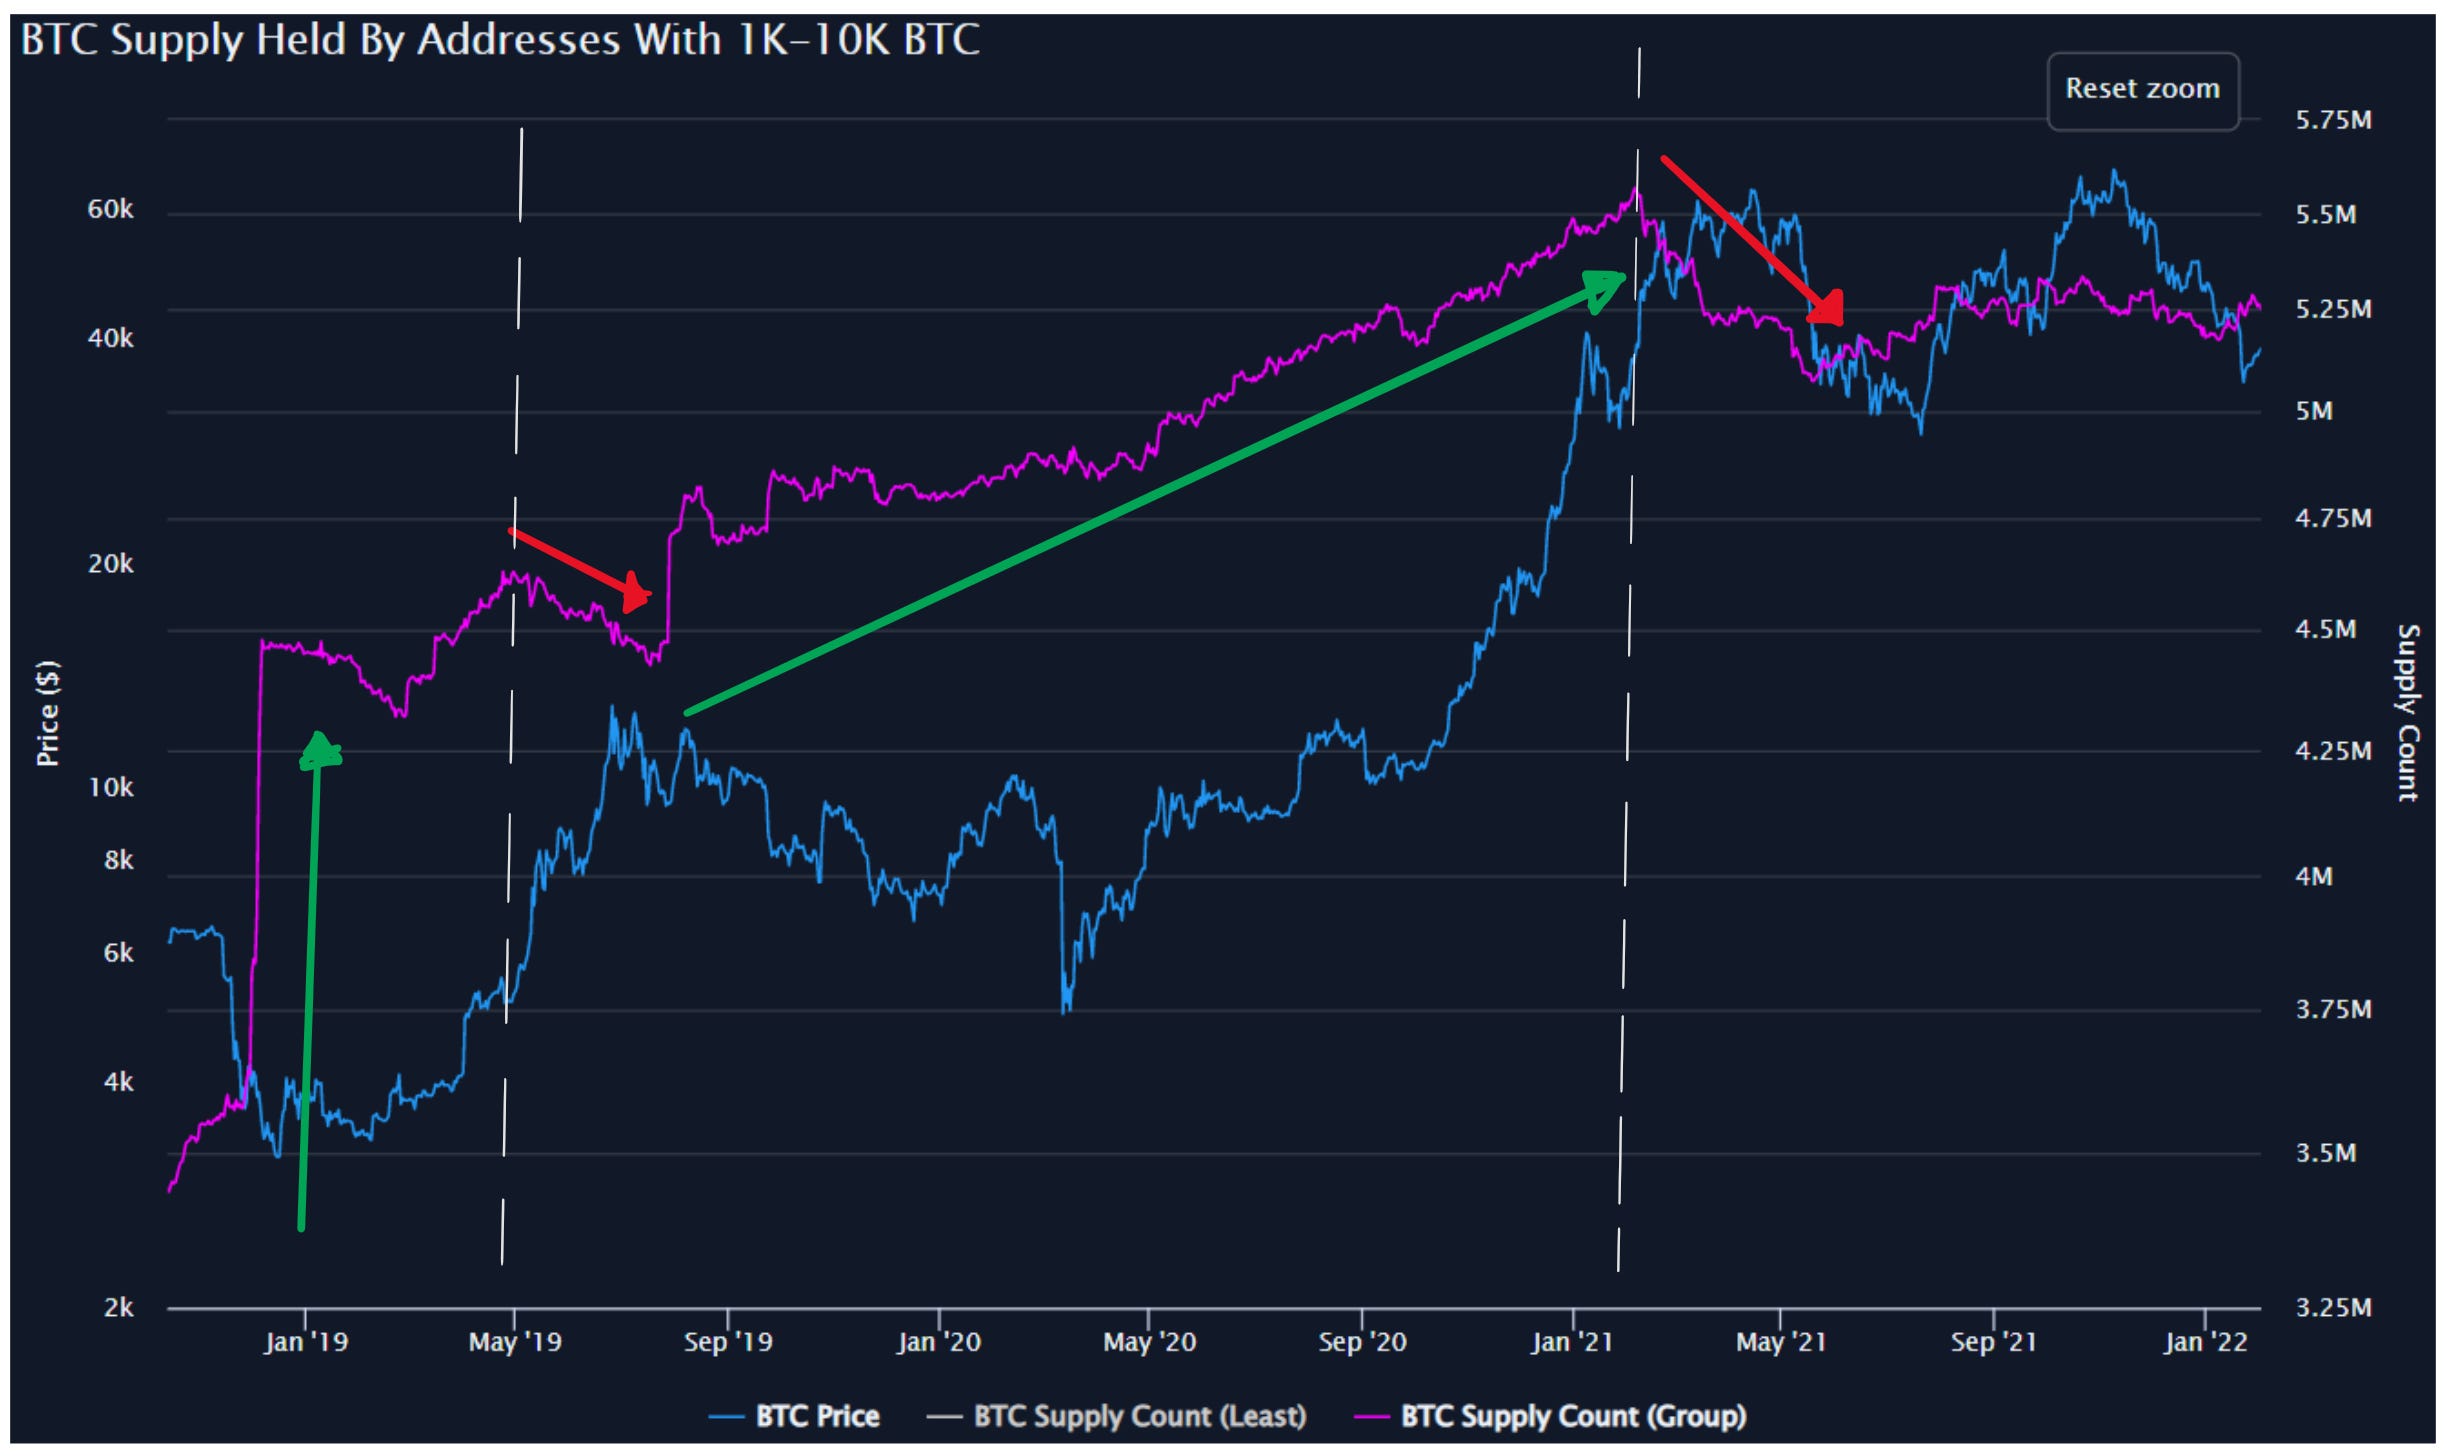
Now let’s zoom in to today.

Following the aggressive sell off before the May crash, they once again started buying the dip at $30k. However, after price rallied back up and made new all-time highs above $63k, they started selling once again. Had I been following this at the time, I may have done the same.
This selling continued all the way until price fell to $40k, but the trend looks to have now changed as whales have started buying once again. Will Clemente also pointed this trend shift out a few days ago:

These whales are clearly very good at selling when price is overvalued and buying when price is undervalued. They are a leading indicator - they can help predict future trends in price, so it’s a good sign to see the whales have started buying again. This does not mean we can’t fall further; it simply adds confluence to the fact that Bitcoin is becoming undervalued at these prices.
There are certain faults with this metric, because investors can split up their funds into smaller wallets, but overall, it seems to act as quite a good leading indicator. When the supply held by whales increases, price seems to follow, and vice versa.
Currently it is in an uptrend, but unlike the smaller wallets, supply held by the whales is yet to make new all-time highs. Until we see new highs in the supply held by these whales, it is possible that we do not see a parabolic Bitcoin price rally.
My intepretation of it right now is that whales are willing to buy Bitcoin at $40k. If we go back down to $30k or even below, the demand will be huge, and I wouldn’t count on it being down there for long.
The risk/reward at these prices is fantastic, and it just gets better the lower we go. I would honestly love a dip down below $30k but I’m prepared for either scenario.
Here’s a nice thread highlighting the current risk/reward:

Make sure you don’t fall into the trap of believing price will only go one way i.e. don’t prepare your entire investment plan around one scenario. Be aware anything can happen and position yourself accordingly. At the end of the day, the simplest, most fool proof strategy is to DCA.
As Charlie Munger says:
“It is remarkable how much long-term advantage people like us have gotten by trying to be consistently not stupid, instead of trying to be very intelligent.”
It’s easy to make money. It’s a lot harder to keep it.
My Bitcoin Plan
Not having an investment plan is like running around a rainforest, naked, with no knowledge or awareness of the dangers ahead. It doesn’t have to be complicated, but it is essential.

Back in October, the previous plan was to hold all current investments but to set aside 20% of the portfolio in cash (USDC) to earn a yield, ready for the worst-case scenario, like a stock market crash.
We are currently seeing the worst-case scenario play out. The Fed is tightening monetary policy and stocks are coming crashing down.
The plan now is place limit orders on Bitcoin.
The first set of limit orders have been placed from 29-36k (blue). 2 have been filled already.
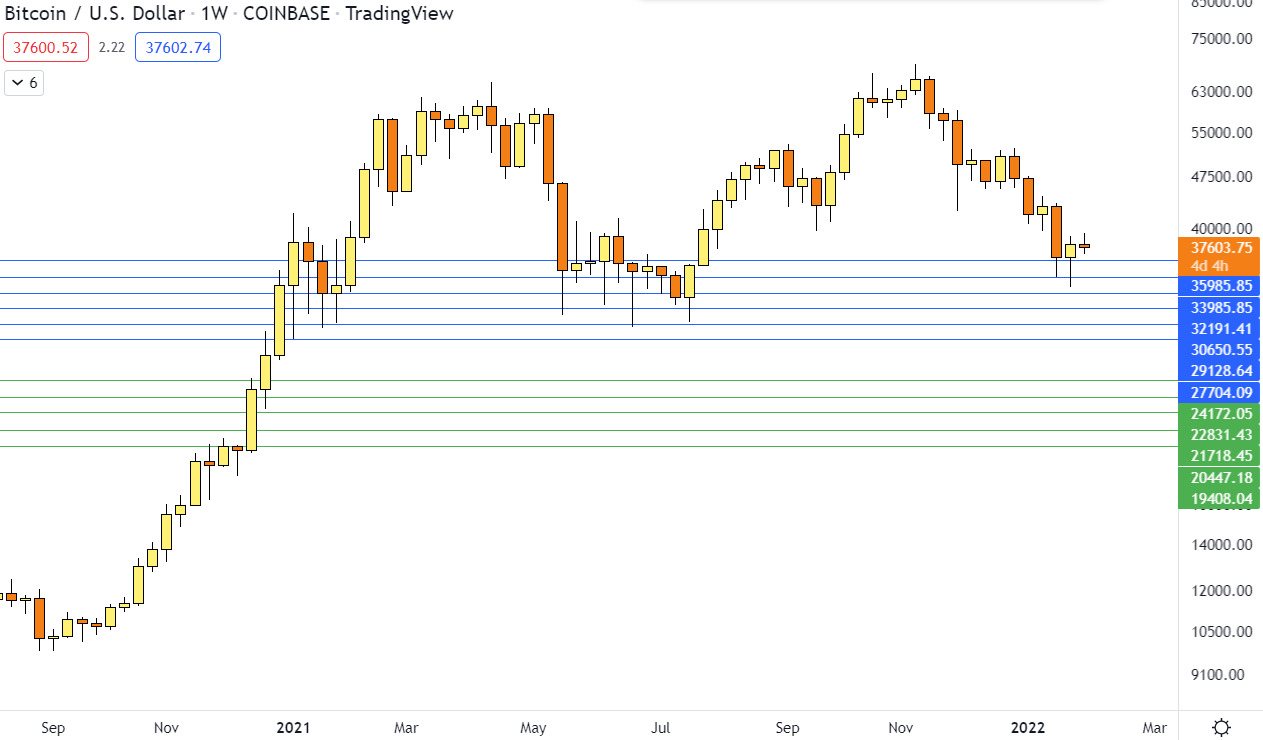
The lower limit orders are yet to be submitted as the cash is still being staked and I am waiting for a few more limit orders to be filled before submitting the lower ones.
I thought about weighting the lower band (green) of limit orders much heavier than the upper band (blue) but I don’t want to be greedy. If we get a $29k Bitcoin, I’m going to grab it, so the upper band (blue) is worth 40% more than the lower band (green).
I have weighted the lower levels of the upper band greater than the higher levels. The same will be done with the lower band.
If Bitcoin were to rocket up tomorrow, and miss these orders, it wouldn’t matter as we are already happy with the amount we have invested into crypto.
However, if Bitcoin crashes to these lower levels, the limit orders are there to take advantage of the lower prices. The lower Bitcoin goes, the lower the risk of investing in it. So, by buying at these levels, we are increasing our Bitcoin exposure without significantly increasing our risk exposure.
The reason for not choosing to DCA is that we already feel like we have maxed out our risk tolerance, and therefore are only willing to invest more when price is lower.
This is my plan and it probably won’t be yours. Just make sure you have one.
If you wouldn’t be ok with price rocketing up tomorrow, I suggest DCA-ing with maybe some limit orders, unless you are a momentum/trend trader like CTO Larsson and are waiting for the trend to reverse before buying back in.
Likewise, if you wouldn’t be ok with price crashing to $20k, you may want to de-risk and build a cash position until the bullish momentum returns.
Whatever you do, have a plan before you press any orders.
Bitcoin Levels
Bitcoin has broken the key area of $40k and we’ve had a textbook retest of the level and the trendline.

The next obvious area of support is around $30k. And that’s my only qualm, it’s obvious and it almost feels too obvious. It seems like everyone and their mum is waiting for a $30k Bitcoin to get their buy orders in.
It seems like we either front run $30k, so that Bitcoin never actually reaches it, or we crash through it down to the low 20s, freaking everyone out before moving on up. Either way, it doesn’t really matter and I look forward to seeing it all play out.
CTO Larsson touched on this issue in his recent video:
So, if we do go crashing down:
How Low Could Bitcoin Go?
It’s impossible to predict when the bottom will be or where exactly it will be, but it is possible to find a range in which it is very unlikely for Bitcoin to go below.
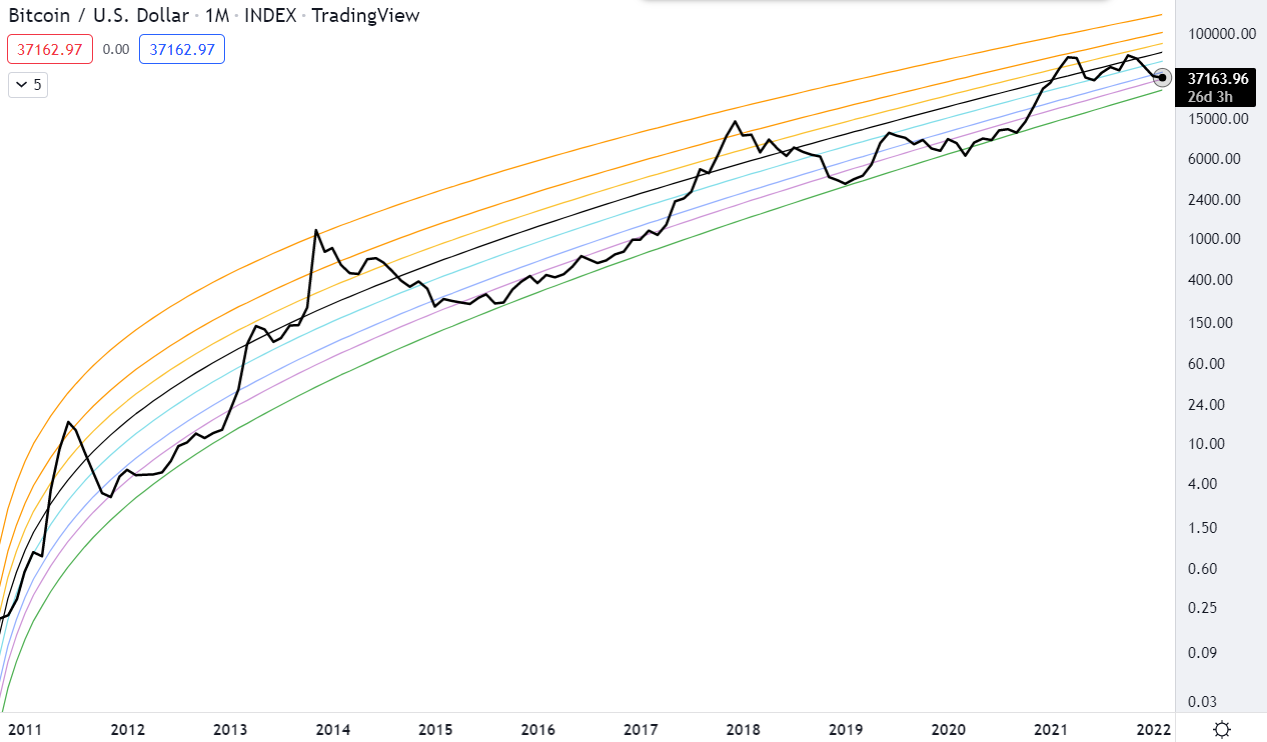
Here are the possible areas for a bottom on numerous indicators, which can help us form this range.
Lower Regression Band (Green): Currently $14k - $29k
Price is in black. Indicator is Red and Green.
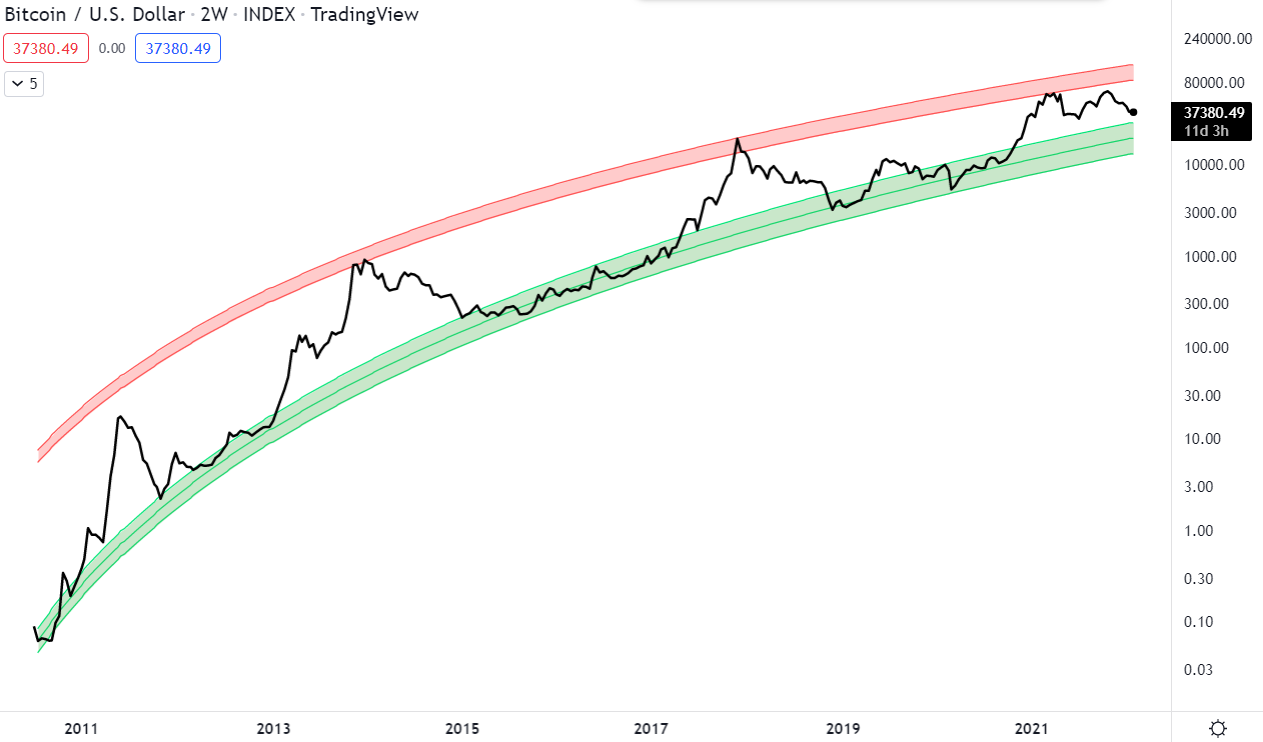
This is logarithmic function based indicator. Bitcoin has never closed below the lower green band(except at Bitcoins inception). This band will trend up with time, so the longer Bitcoin moves sideways, the higher the theoretical bottom will be.
The Bottom Of The Cowen Corridor (Green): $33k

An indicator originally created as a joke by Ben Cowen, which is a function of the 20W SMA. It held up amazingly well during the May crash and has recently bounced perfectly from it. It has only ever been breached to the downside during the March covid crash and briefly in June 2021.
Lowest Band of the Bitcoin Log Growth Curves: $28k
Another logarithmic indicator. Bitcoin has only ever closed below the lower band once - breifly during the 2020 March covid crash.
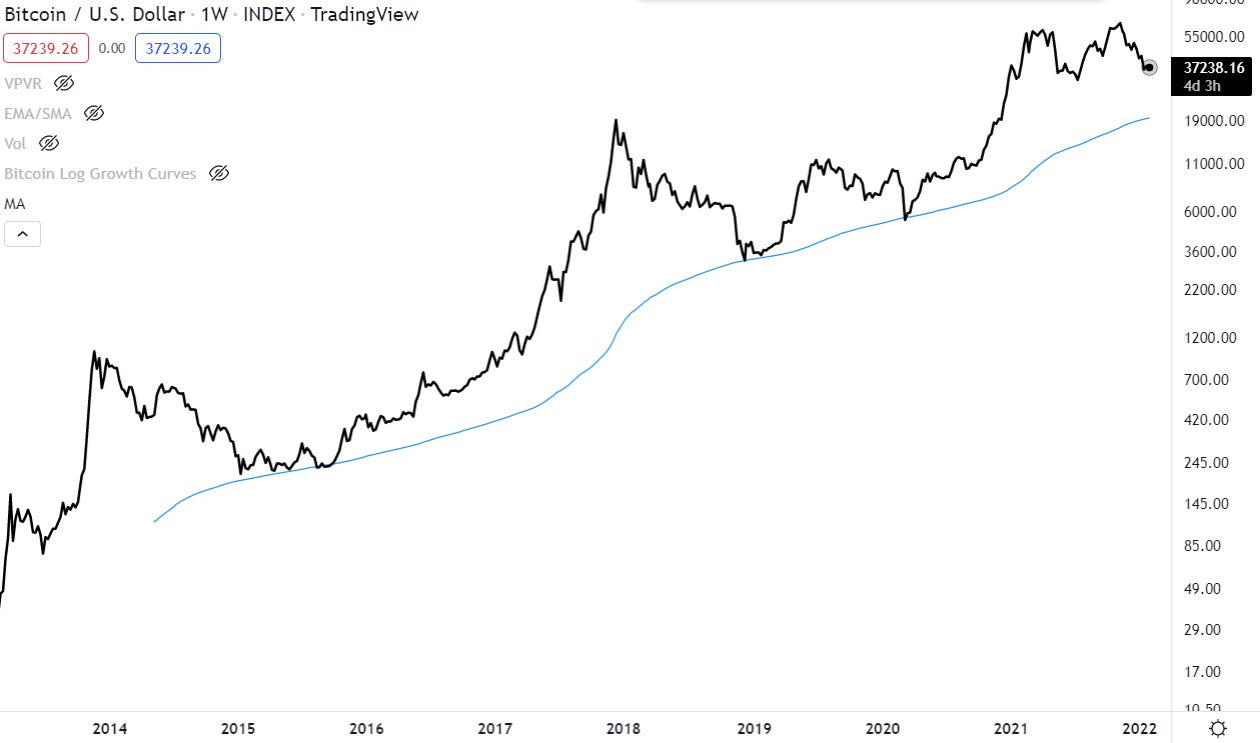
200W SMA: $19.5k
The 200-week simple moving average. Price has only closed below during the 2020 March covid crash and in the 2015 bear market and only very briefly.
PlanC: $17295 - $33053
On-chain analyst ‘PlanC’ did a similar analysis, and you can see his findings below:


Conclusion
You can clearly see we are nearing the bottom of almost all indicators. The range for the bottom is from $14k - $33k. This is a rather large range, but then Bitcoin is volatile.
Up until now Bitcoin has been meandering in no man’s land, but finally we have some clarity. Bitcoin is undervalued and it’s a great time to DCA.


Bitcoin oscillates up and down with an overall uptrend. We are nearing the lower end of an oscillation and I feel blessed to be aware of it. Please take this time to learn about money and the value proposition of Bitcoin.
Here’s two excellent threads to get you started, don’t get caught up on anything you don’t understand, and enjoy the learning:


To finish this section, here is an extract from Will Clemente’s newsletter:
For this correlation to break, we either need traditional finance (particularly QQQ) to rebound, allowing Bitcoin to trade like a high beta asset to rebounding equities; or some type of catalyst for BTC to break the correlation. There is no shortage of interesting news for the asset lately: Russia rumors, Intel getting involved in mining chips, Google looking to store crypto in partnership with Coinbase, Apple and Microsoft talking about the “metaverse” on earnings calls, El Salvador Bitcoin bond raise coming up, rumors of other LatAm countries following them. I’m not saying you should blindly bet on one of these catalysts occurring, but these are some of the potential events that could break the correlation. For the time being, we are stuck to the hip of equities.
For value-based market participants, we feel that the low 30Ks/upper 20Ks are a value area for Bitcoin. this is partially based on price action, as well as macro bottom indicators such as the 200W, realized price, and delta price being in the mid 20Ks. Calling the exact bottom is a bit of a fool’s game, but sometimes it’s as simple as asking yourself where the asymmetry lies. We believe the asymmetry is not skewed the downside with Bitcoin in the low 30s/upper 20s. Does this rule out a potential capitulatory wick on some type of macro breakdown? No. This is also why buying a lump sum and trying to time the bottom is probably not the best idea. Averaging into these levels with a multi-month horizon is the approach we are taking. (NOT FINANCIAL ADVICE)
P.S To anyone selling, the big man has bought your Bitcoin again…


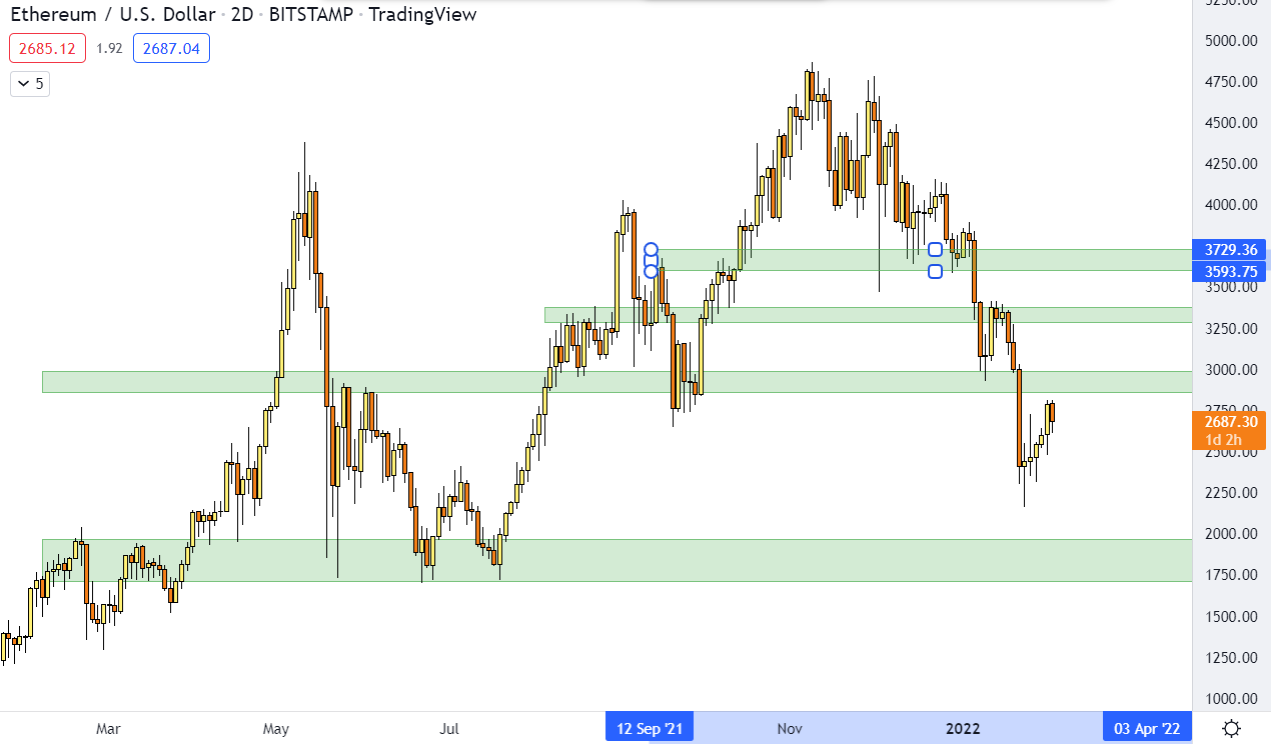
Ethereum
Once again I don’t feel much need to chart Ethereum. It looks much the same as Bitcoin, just with a bit of a lag, and until Bitcoin resumes its uptrend, it’s unlikely Ethereum will do much. It’s currently in a range from around $2-$3k and still in the larger macro range from $2-$4k.
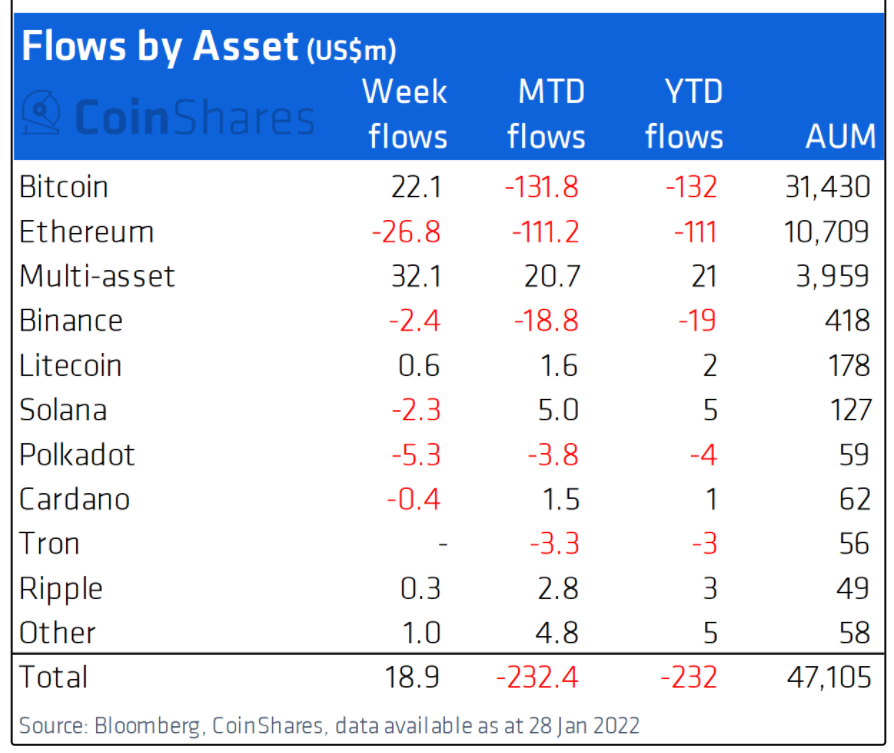
The market is in a risk off environment, so naturally money is slowly flowing to Bitcoin, from altcoins.
We can see this in the most recent coinshares report, which shows the money flow into and out of digital asset product. Pretty much everything is red except for Bitcoin.
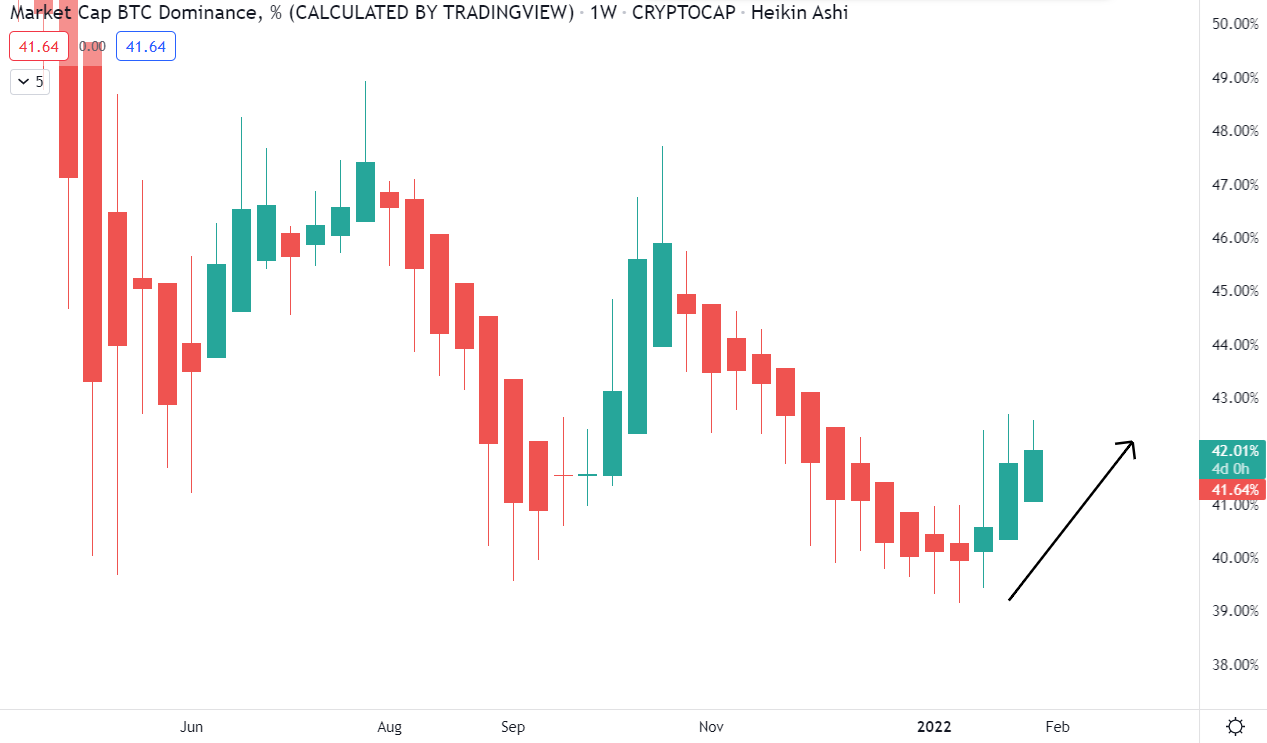
And we can see this in the rising of the Bitcoin dominance - The amount of market share Bitcoin takes up in the entire crypto asset class.
News Highlights
The price hasn’t done much, but a lot keeps happening behind the scenes. It’s getting late so I’ll keep this section brief.
Will Clemente has summarised the recent news pretty well:
On top of this, stuff is popping off in America:
The Mayor Of New York Received His Pay Check in Bitcoin

States Start Moving in on Bitcoin


And down in South America:

IMF Urges El Salvador To Drop Bitcoin as Legal Tender

Scared IMF?
Personal
The Wi-Fi at home has been down the last few days so I haven’t had time to fill out this section of the newsletter.
But for those of you who are younger, it seems like no one has any idea what they want to do in life, so here are some videos I thought you may find of value:
Thank you for reading, and I wish you all a wonderful week!
Best wishes,
Tats
The information contained herein is for informational purposes only. Nothing herein shall be construed to be financial legal or tax advice. The content of this email is solely the opinions of the write who is not a licensed financial advisor or registered investment advisor. Trading cryptocurrencies poses considerable risk of loss. The writer does not guarantee any particular outcome.