

What the Macro is Going On?
Time To Look at The Bigger Picture

Hey guys,
What a mental few weeks it has been. I can’t think of any Netflix show more entertaining than the current macro-economic environment. Ok fine, Stranger Things Season 4. But anyway, I hope you are all doing well, and no one is freaking out over the current bear market in stocks and crypto. The sun has been shining and I hope you have all been getting some well-needed Vitamin D.

It’s been a pretty hectic month, so finishing this edition has been a bit of a struggle. Sometimes it takes a little while to get into the flow of a topic, and this was the 3rd topic I wrote about before I felt happy with the content. I’ve cut it very fine, as I’m leaving home for Glastonbury today… Mum, being the don that she is, is also coming up with me and a friend, and is currently shouting at me for not having packed.
So, without further ado, I have to go. If you wish to share this newsletter with any family or friends, use this juicy button here:
And if you wish to subscribe, please do so here:
Bankruptcies
Before we get into the meat of this newsletter, a quick word on bankruptcies. It is in bull markets that fools are made, and in bear markets that they are uncovered. In bull markets, companies, like people, can struggle to manage risk properly. They over leverage and struggle to maintain strict capital allocation.

Now we are in a bear market, those who have been swimming naked are getting revealed. Terra Luna was the first to fall. Next, we have Celsius and 3 Arrows Capital. Celsius is a centralised lending service where people can deposit their crypto to earn a yield and take out loans. 3 Arrows Capital is a major crypto hedge fund. Both of these were over-leveraged and had some exposure to Terra Luna, and have been unable to weather the storm.
There are risks that you take when you leave your crypto on a centralised platform and we are starting to see those risks in real time. Exchanges are generally safer than lending platforms, but they still come with their risks. My personal favourite when it comes to safety is Kraken or Gemini, but there are also others. If you have a significant amount of money invested, then you should seek self-custodial solutions like a Ledger Nano S or Casa has a great multi-sig service.
With many companies starting to lay-off workers, I was impressed by both Binance and Kraken, who both came out saying they are still hiring people.


Hilariously, the Binance photo isn’t even a proper photo, he just photo shopped himself on to a stock photo😂.


I’m not going to go into the details of either of these cases, so let’s crack on.
Macro Macro
Last week we looked at where a possible bottom could be. This week I’m going to take a look at when this could happen, and in order to do this, we have to take a look at the macro environment.

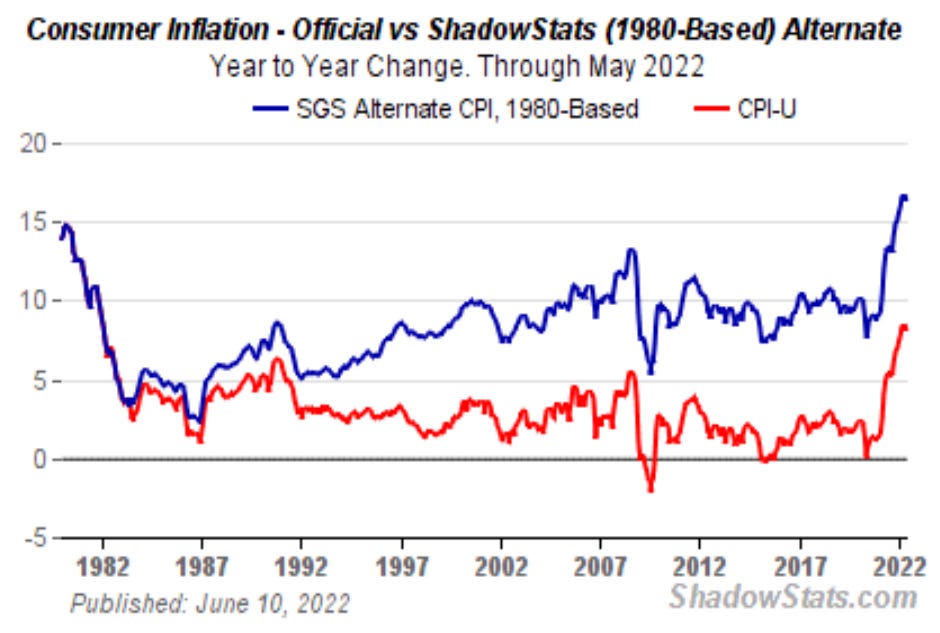
Inflation, inflation, inflation. We can’t talk about anything without talking about inflation. Inflation is measured using the Consumer Price Index (CPI), a basket of good which is roughly meant to equate to what the average consumer buys. On Friday the 11th latest CPI inflation reading came out at 8.6% year over year. The highest reading since the 1980s.
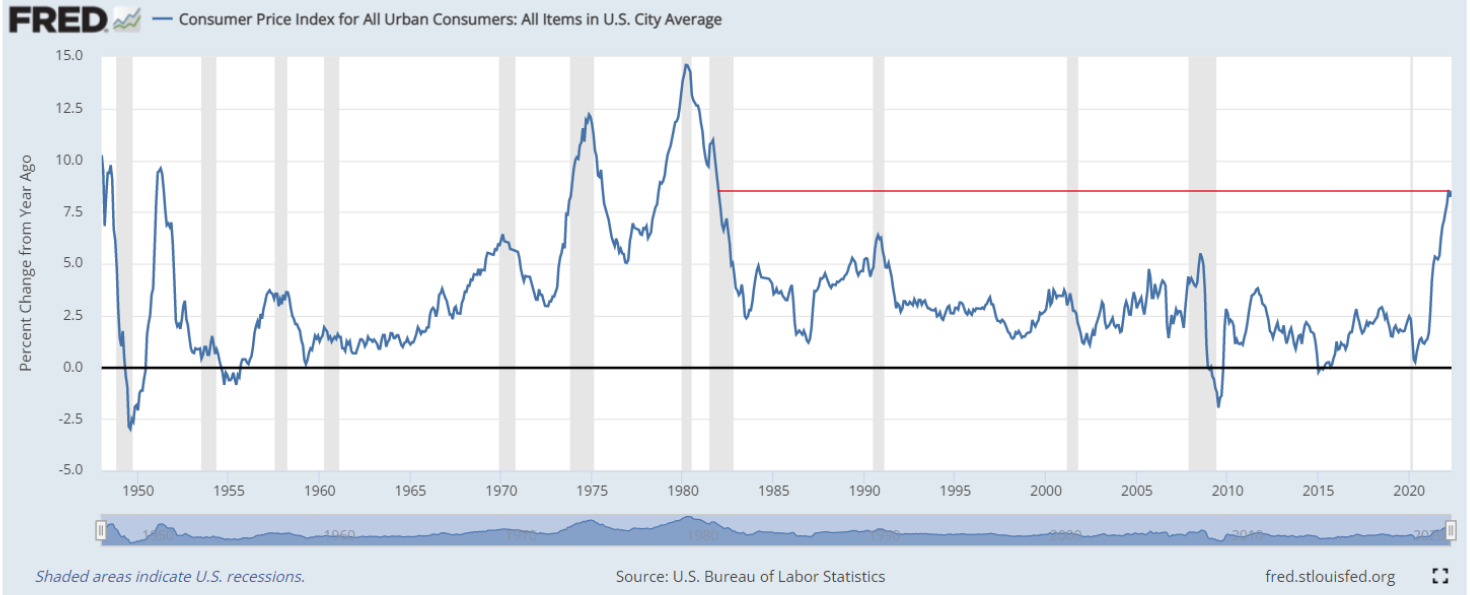
However, todays CPI is not the same CPI they were using in the 1980s. If we measure today’s inflation in the same way, inflation is in fact closer to 17%! This is in fact much larger than the peak inflation they were experiencing in 1980.
So, what’s the cause of all this??
Inflation is a simple matter of supply and demand. If there is an increase in demand and supply does not increase as well, prices will start to rise. When prices start increasing dramatically, people may actually buy more of those goods, as they fear prices will continue to rise. People may also start demanding higher wages, which in turn increases the costs for producers, who in turn have to raise prices to make up for higher wage costs. Both of these self-reinforcing cycles lead to more inflation, so you can see that inflation can be quite a dangerous beast if not tamed properly.
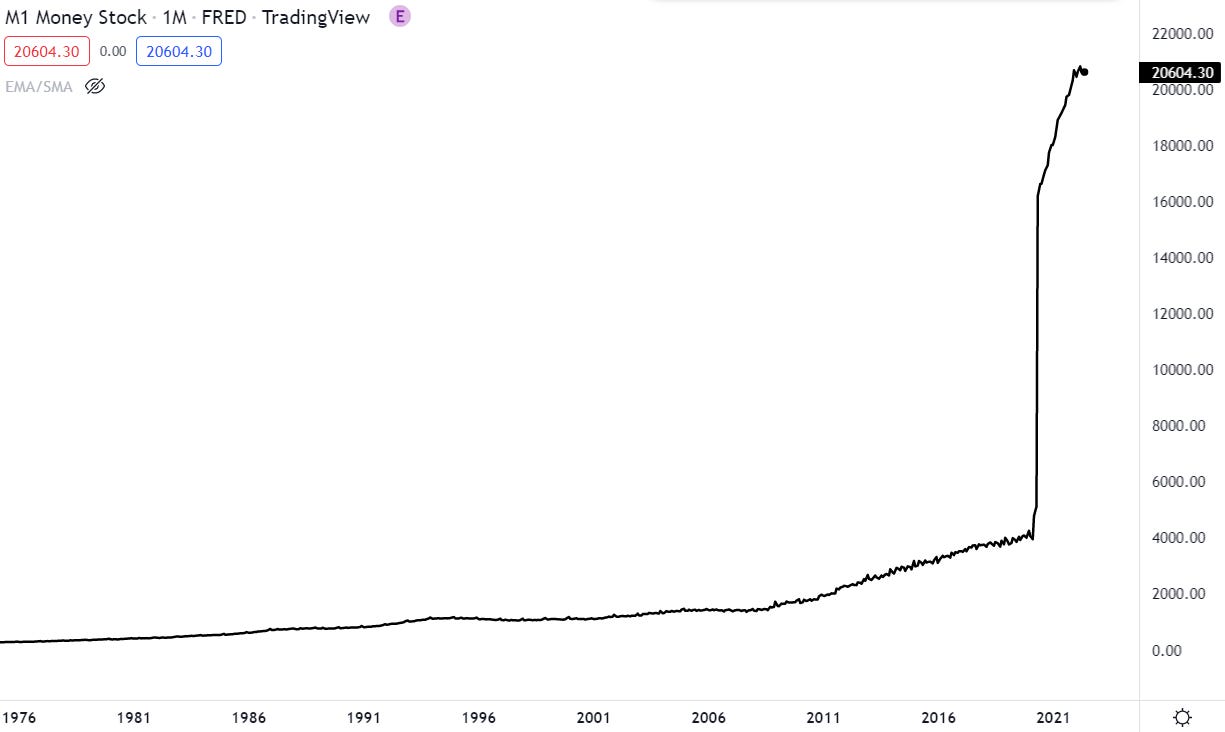
Today’s inflation is a terrible concoction of many supply and demand issues. To begin, the stimulus checks in response to the covid pandemic lead to huge supply increase in the M1 money supply (all physical coins and cash notes including money in bank accounts). As you can see this went absolutely vertical*.
*This was in part due to a change in their calculation method. However, only partially, as the similar increase can be viewed in M2, which did not have any changes to its calculation.
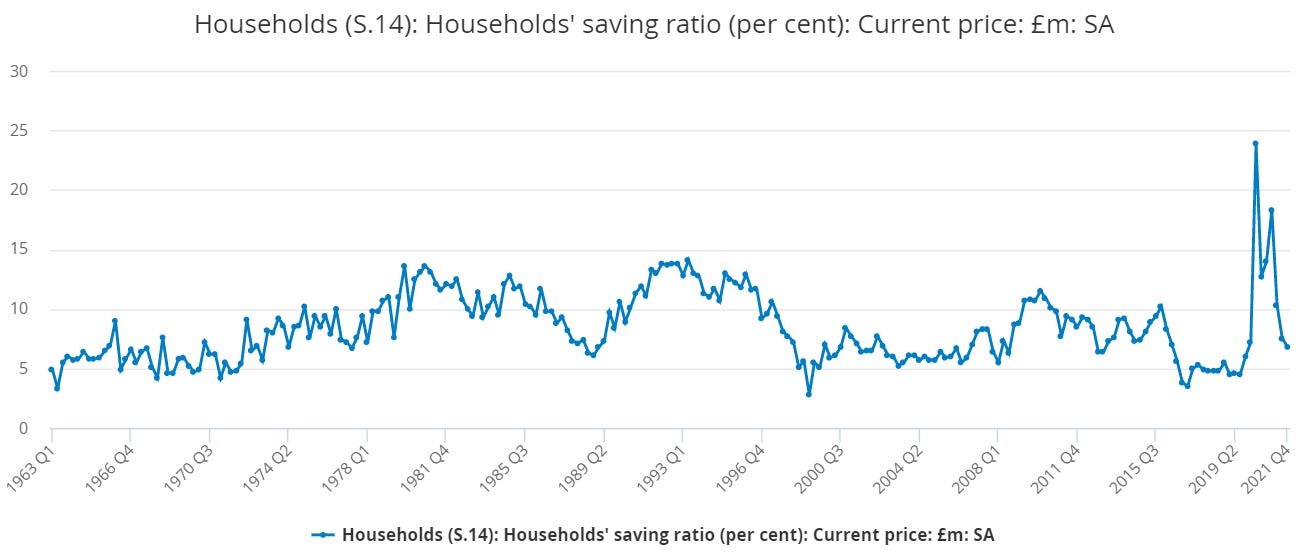
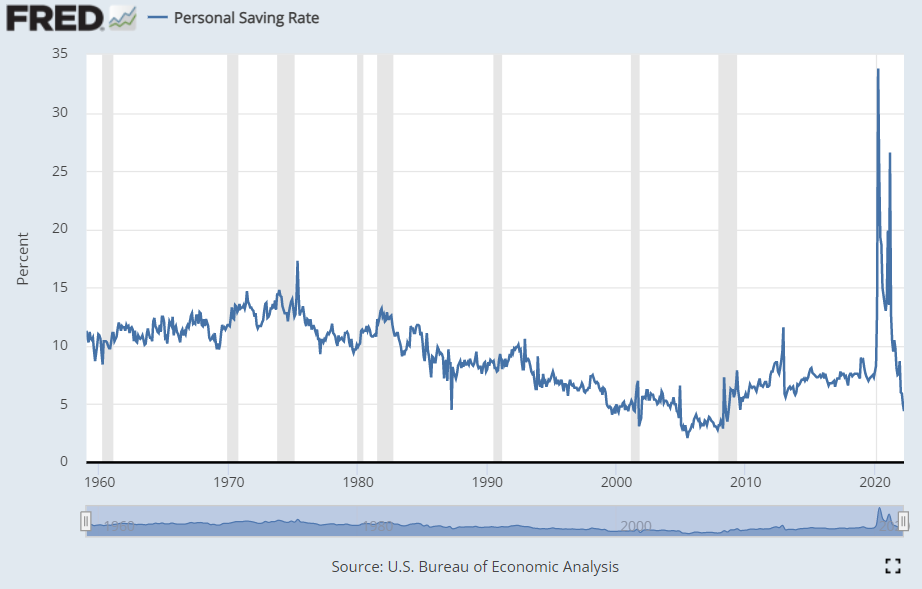
It’s quite hard to give out the correct amount of money, to each individual, that would make up for their loss in regular income, so they ended up giving out a surplus to many people. This combined with the fact that people couldn’t even go out to spend the money, lead to a huge increase in savings rates.
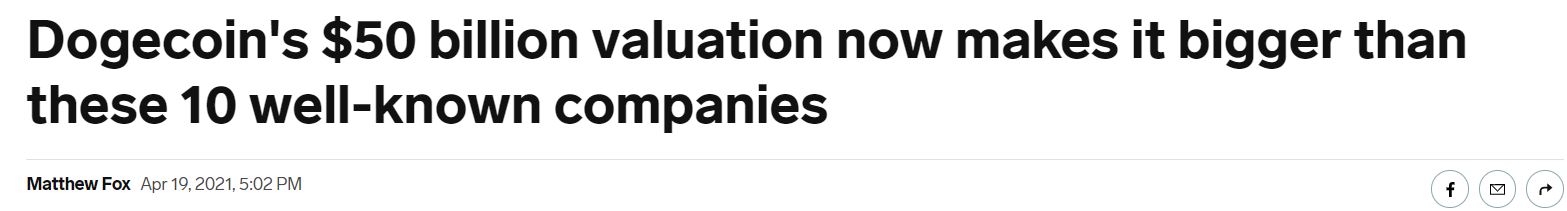
The first place this money flowed into was financial assets, which gave way to huge speculative bubbles in stocks and cryptocurrencies. At one-point Dogecoin was worth more than many companies in the SP500!
Housing prices also went mental as people looked to start upgrading their houses and upgrading their standard of living. Inadvertently, this money also started to spill into everyday goods. Combine this extra demand with supply chain issues due to covid, and you have a good recipe for inflation.
On top of this, commodities already looked set for a new bull run, due to many years of underinvestment, leading to a shortage in supply. When commodities are expense, due to less supply relative to demand, a lot of money flows into the commodity space as high priced commodities lead to high cash flows, which attracts investors. Companies then go out and build more infrastructure with this extra money. Eventually this leads to a big increase in supply which ends the bull run and commodities are once again cheap. Money flows out, and there is less build out of infrastructure, and back around we go.

This chart above from 2021 really highlights these cycles and how oversold commodities were in 2021. The cycle low was pushed even further than normal due to the green movement and the emergence of ESG investing. ESG stands for environmental, social and governance. If a company has good environmental practices, treats workers well and has good diversity, and is well run, it is considered ESG friendly. Over the last few years everyone has started to favour ESG companies, and many funds do not hold a stock if it isn’t ESG friendly. Naturally oil and gas companies did not meet the environmental criteria, so this decreased investments into these companies even more. Generally, oil and gas companies have been the hated ‘bad guys’ for the last few years.
Yet as much as people hate oil, everyone still needs it and global demand for it looks to keep growing.


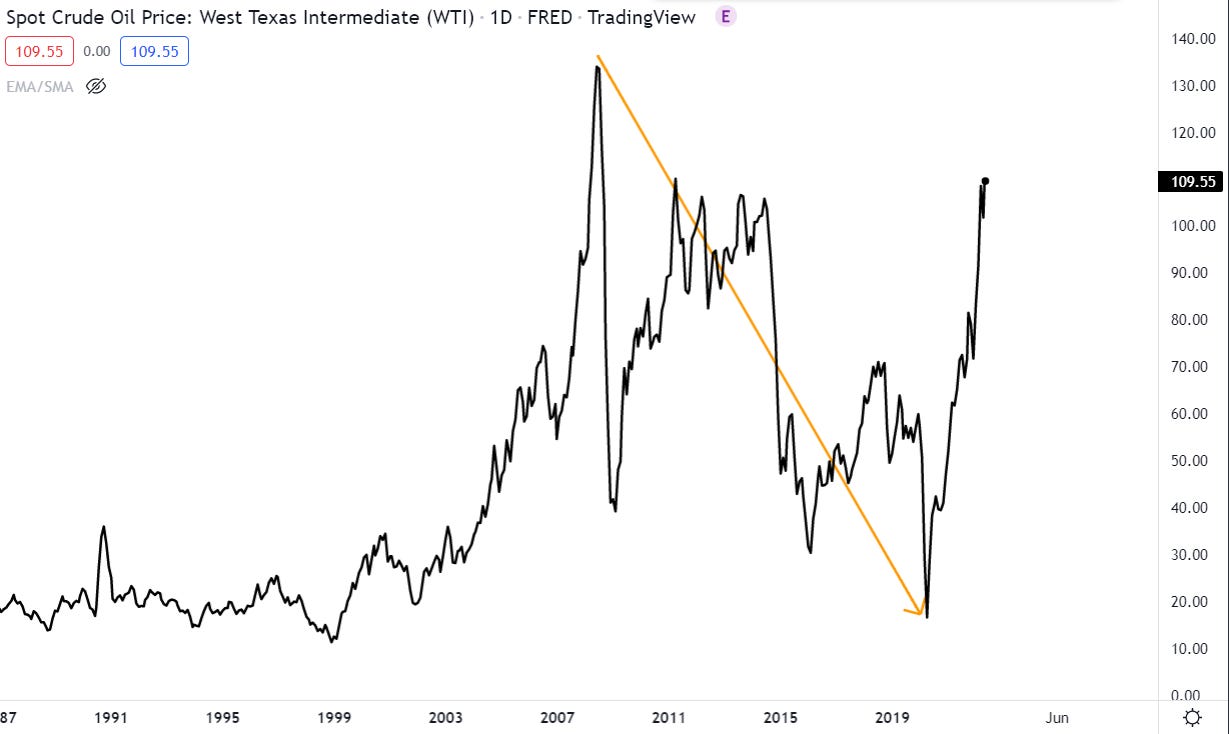
The coronavirus lockdowns was the final nail in the coffin for many of these oil companies, as demand dropped off a cliff, causing oil prices to go negative.
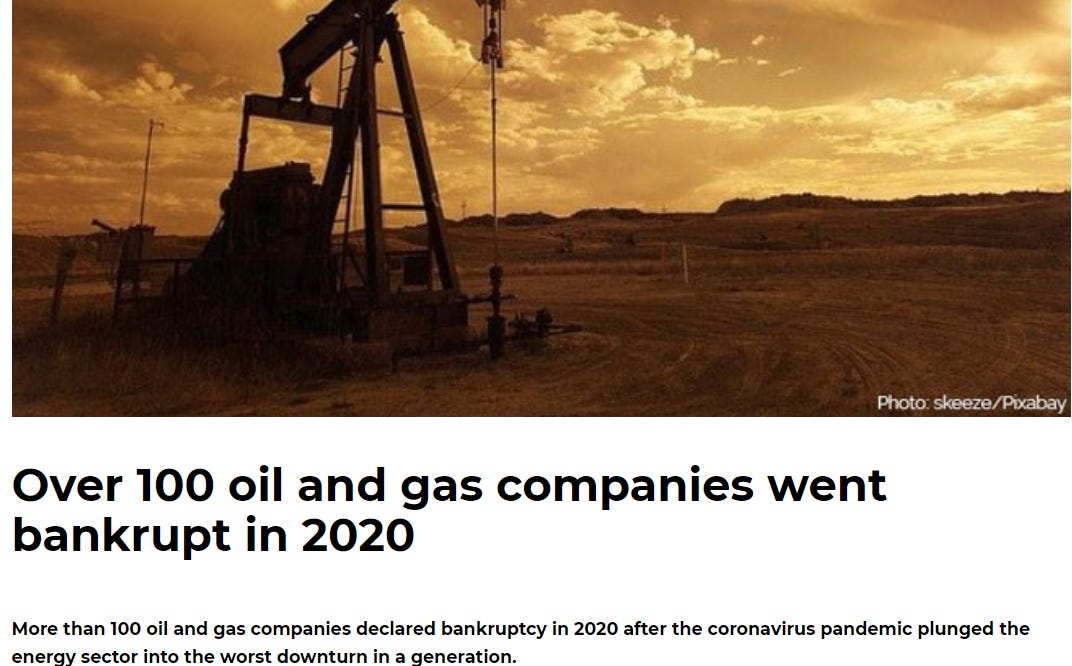
Oil had already been in a bear market since 2008, and this final capitulation really marked the bottom.
As commodity prices started rising all around the world, Russia invades Ukraine, and makes matters worse. Russia is the #3 global producer of oil, #2 global producer of gas, #2 exporter of cobalt one of the key elements used in rechargeable batteries, #2 producer of vanadium, which is used in large-scale energy storage and steel making. The list could go on. They are one of the biggest commodity producers in the world.
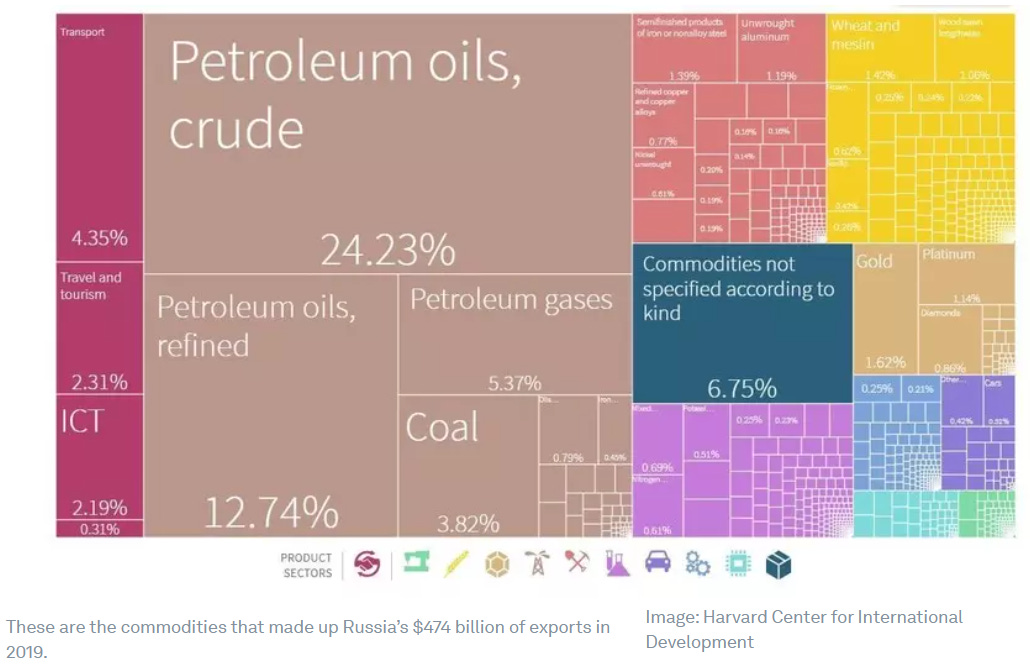
Naturally, the conflict made these materials more scarce and prices increased dramatically, adding more fuel to the fire of inflation.
Although most were not quite aware of it yet, this was also the perfect recipe for global food shortages. On top of the industrial commodities, that Russia exports, they are also the world’s largest exporter of fertilizer.
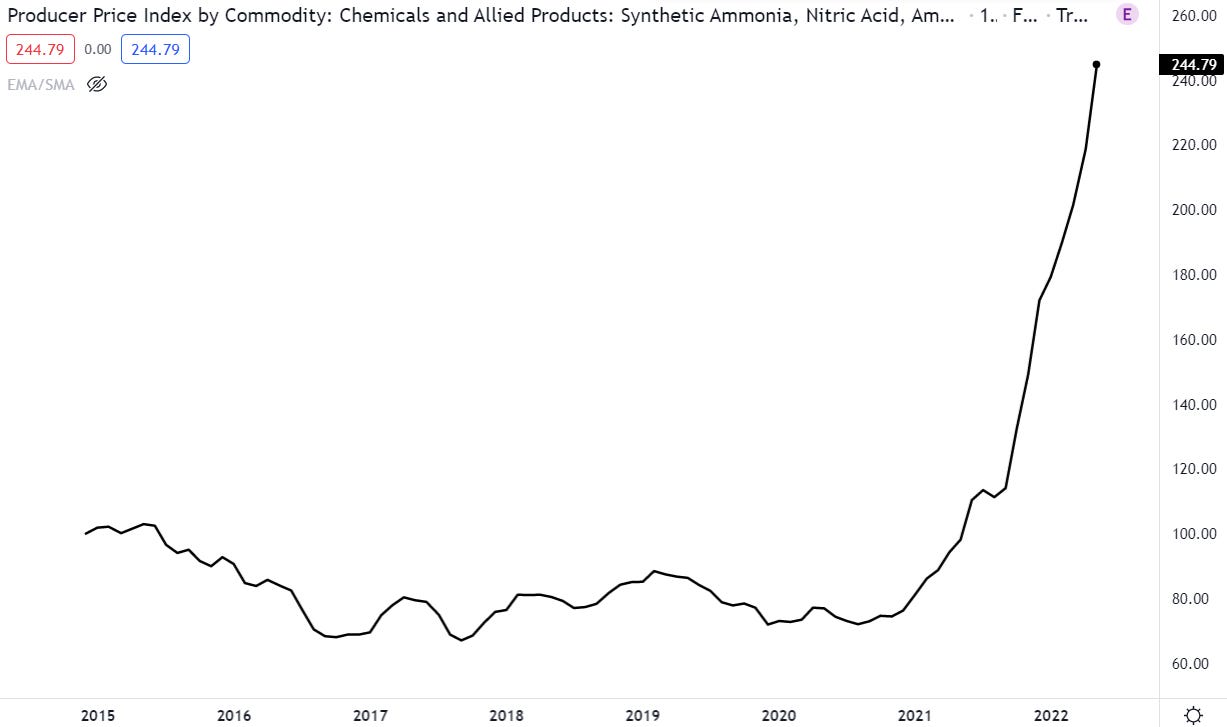
Fertiliser is made out of natural gas, and as everyone knows natural gas prices skyrocketed. Not only was the supply coming out of Russia tighter, the cost of making fertiliser also increased drastically, leading to an unprecedented rally in the price of fertiliser, which has yet to slow down.
To top it off, Russia is the worlds largest exporter of wheat, and Ukraine is 5th. The world runs on approximately 90 days of supply, and food chains were already very delicate - it doesn’t take much to cause serious trouble.
“But even in developed nations, the prospect of food shortages are perhaps not as far away as we might like to believe. The international food chains that supply us with our favourite foods are precariously balanced.” - Guardian 2019
As the western world went into seeding season, the high costs of fertiliser lead to less crops being sown, which in turn leads to more food shortages down the line. Not a pretty situation. I’m sure you have all been aware of the rising food costs, and it’s unlikely these will stop as we head into the final half of this year.
This entire dynamic was highlighted in the podcast below, that I shared in my March newsletter.
The final factor in this conundrum, is deglobalisation. Since the 90s, when China started opening its door to the world of global trade, globalisation has been a growing trend. The labour force has slowly moved from the west to the east, to take advantage of the cheaper workforce. This led to cheaper costs of producing goods, which led to cheaper prices, acting as a deflationary force. In addition, as demand for workers in the west decreased, real wages started to stagnate. It’s a lot harder for a worker to demand a pay rise, if there’s a high risk of you getting fired due to lack of demand for workers. This has lead to a huge hollowing out of the industrial sector, especially in the US. As you can see below, industrial production has been stuck in this range since the late 90s.
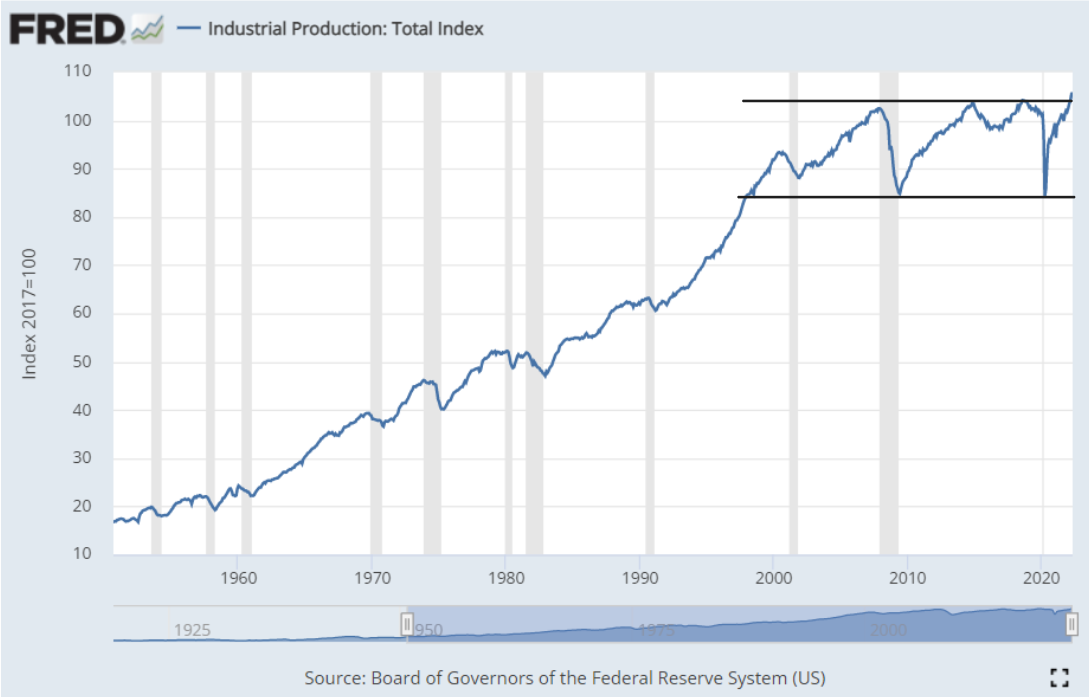
Globalisation trades efficiency for resiliency, and for the last 20 years the shift has been further and further towards efficiency. Eventually, as the ice gets thinner and thinner, it takes but a small crack to bring it all down. Covid was the equivalent of dropping a 6-tonne mammoth on this system, and the war dropped the second. All of a sudden the world starts to realise the importance of resilience and the tide starts to turn. As you will notice in the chart above, it has started to breakout from the range to the upside.

Although this is great for western workers, who will have more work and be able to demand higher wages, it is also an inflationary force. An inflationary force which has been deflationary for the last 20 years. This is huge shift, and one that is only getting started.
Inflation = Commodity Shortages + Stimulus Checks + Supply Chain Issues+ Deglobalisation + Russia/Ukraine
So, where are we at today?
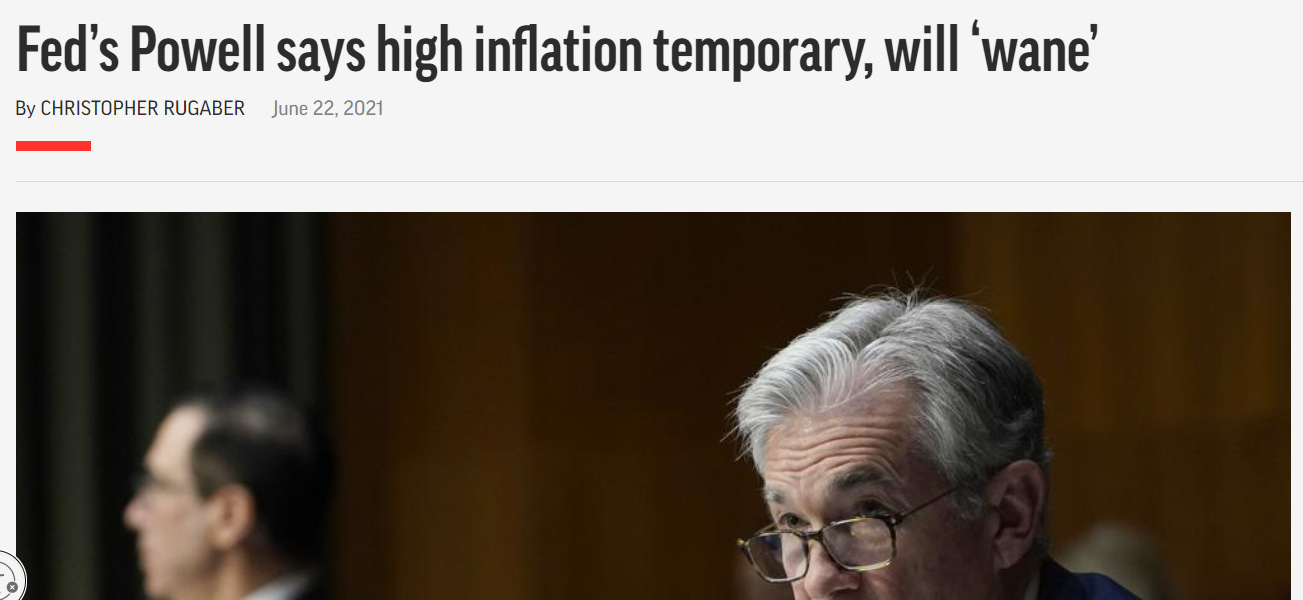
The Federal Reserve’s dual mandate is to maintain ‘price stability’, with a 2% inflation rate, and maximum employment. It is pretty unacceptable to have inflation at 50-year highs, especially after stating that inflation was going to be transitory.
The Federal Reserve is now desperately trying to stop inflation, by putting the printer in reverse. They cannot control the supply side of the inflation equation, so their next best option is to try and bring down the demand. They cannot take back the money from stimulus checks, so their plan is to bring down everyone’s investment portfolios. If people’s houses and stocks start decreasing in value, you feel a lot poorer, and the chances are you spend less.
This is being done by raising interest rates and decreasing the size of their balance sheet via quantitative tightening, the opposite of quantitative easing. Higher interest rates make life harder for businesses as it increases the cost of borrowing money, and as the value of treasury bonds increases, the price at which people are willing to buy stocks decreases. This leads to a declining stock market and a slowing economy.
With the printing being turned off (for now), one of the largest asset bubbles in history is bursting. The assets that benefited the most, are now the ones to fall the hardest.
 Hot Air Balloon Deflating by trc001 on DeviantArt")
The economy heading into a recession is what is needed to kill demand, yet the Federal Reserve is still touting for a ‘soft landing’. What this means no one really knows, but it goes something along the lines of: slow the economy to the ‘perfect amount’, without a recession, and hope that this perfect amount is enough to stop inflation. An equivalent task is the ninja training in which one needs to walk across a floor covered in rice paper without making a rip.
Below you can see the Fed’s interest rate over the last 70 years, and the grey shaded areas, with red dots, mark a recession. As you can see, raising interest rates without a recession is not their forte.


The economy is unsurprisingly taking a hit.


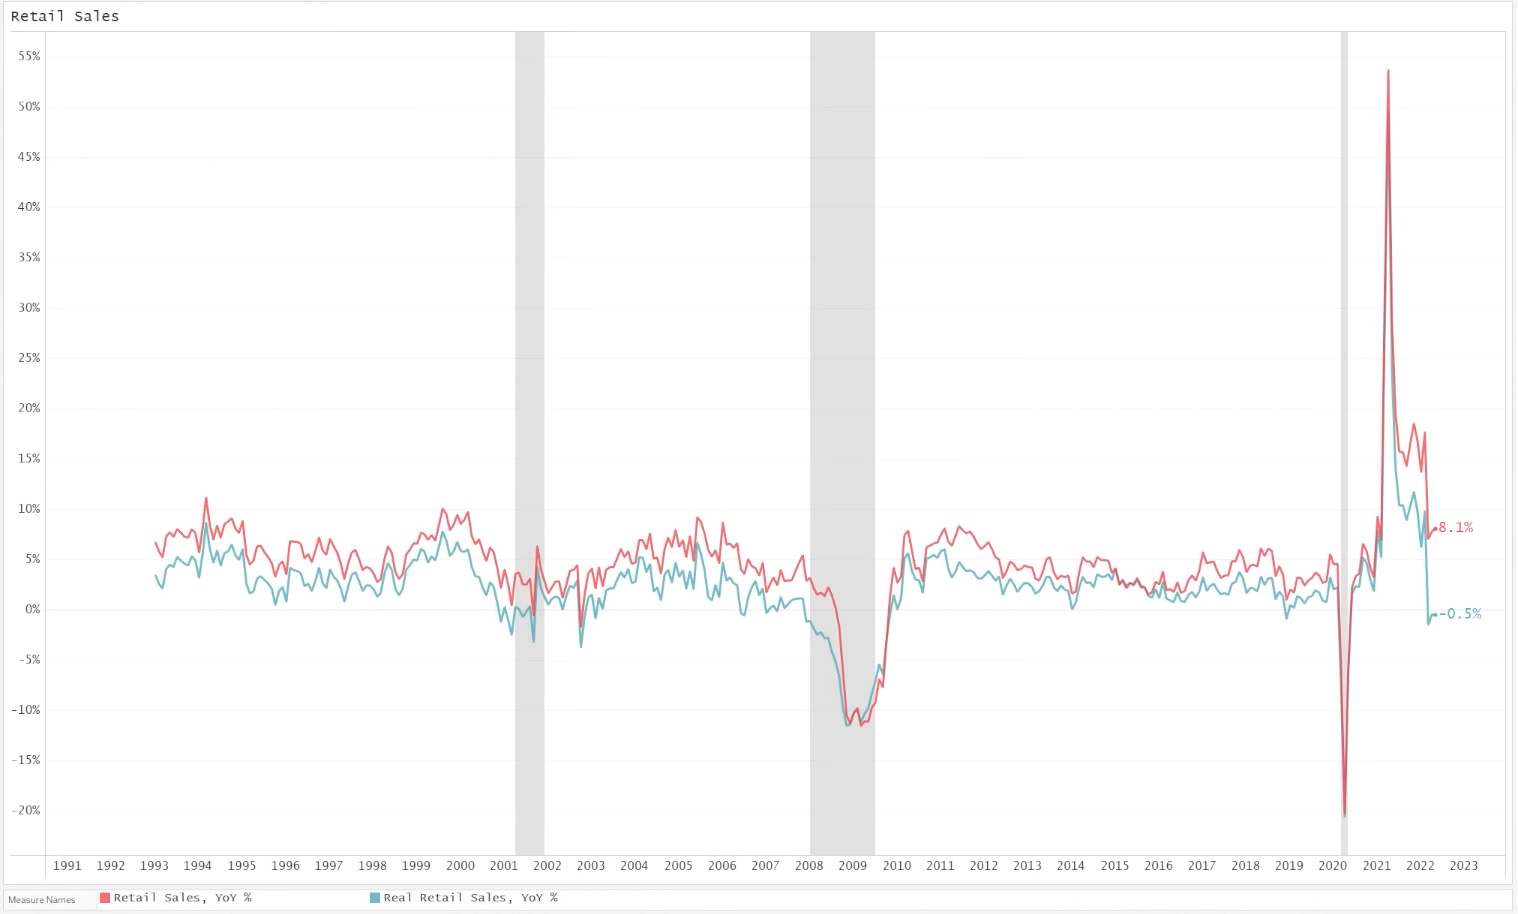
Consumer sentiment is at all time-lows, yet Jerome said last Wednesday that the consumer is still strong. The reason being is that employment is still high and personal consumption is still making highs. However, one of the reasons why it looks like the consumer is still strong is because the cost of goods is higher. Nominal data… So even though Americans are buying less stuff, it looks like they are still going strong because the cost of those good has increased so much.
This chart shows retail sales. In red we can see retail sales (year over year %) excluding inflation, which is still ‘strong’. However, when accounting for inflation (blue), retail sales are in truth in the red.
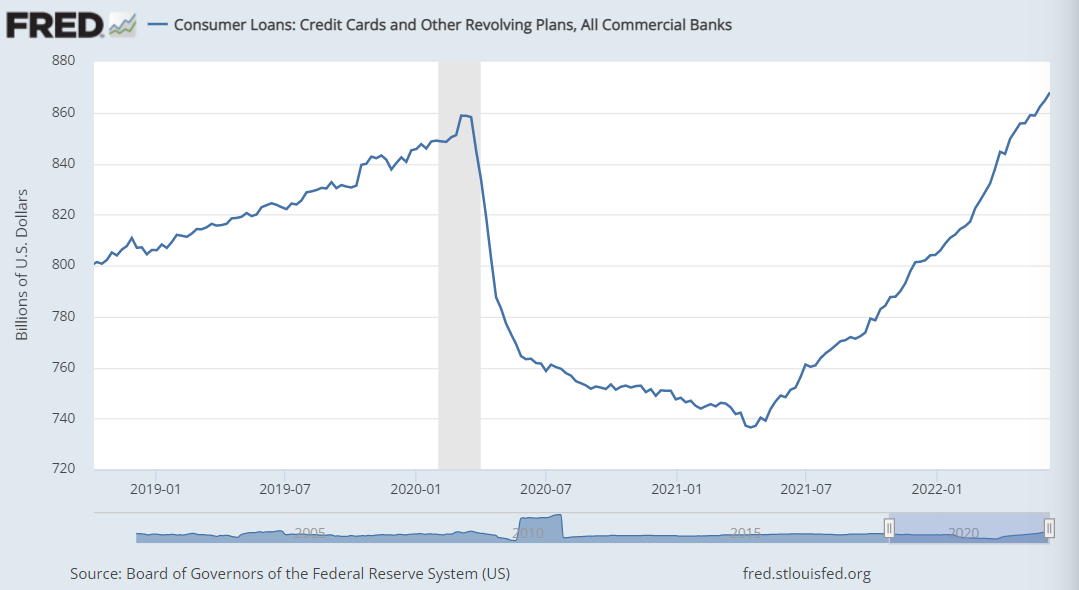
Another aspect the Fed fails to mention when talking about the strength of the consumer, is the crazy rise in credit card debt. Consumers taking on more and more credit card debt in a rising interest rate environment doesn’t make the economy look very healthy.
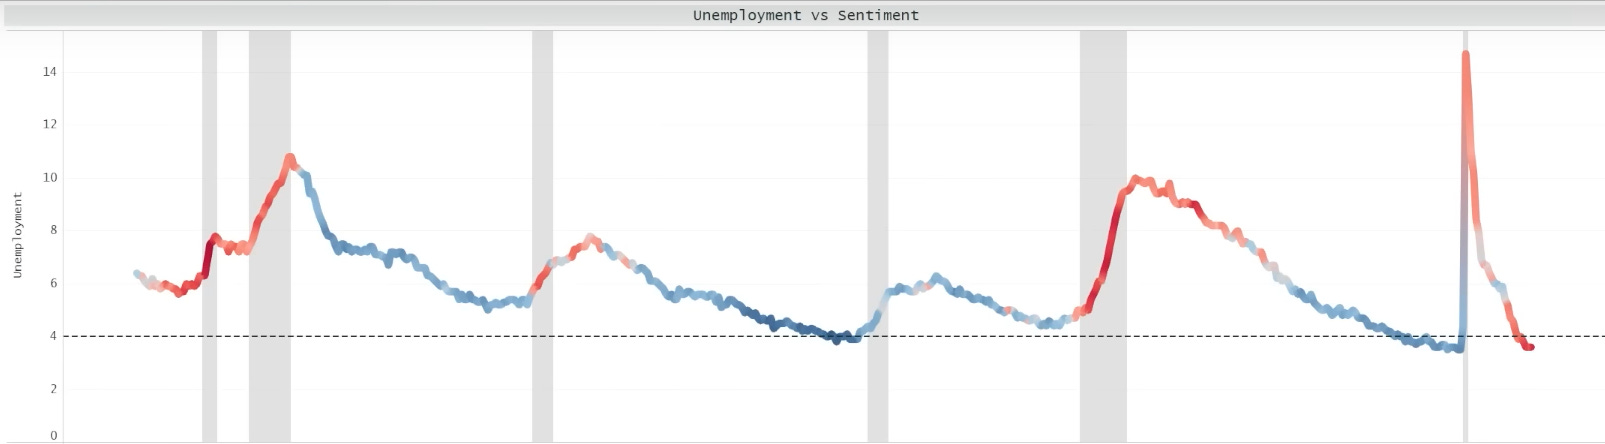
As for employment, the reason it hasn’t fallen yet is because it is a lagging indicator. Consumer sentiment falls, business earnings start to struggle, and then companies start firing people. Typically, when unemployment starts to rise, it rises fast. Rapidly rising unemployment could be a factor that causes the Fed to slow down on the interest rate hikes.
Below we can see unemployment, with consumer sentiment colour coded into it. Currently we have unemployment at historical lows, but very poor sentiment. It feels like there is only one way this can move, and that’s up.
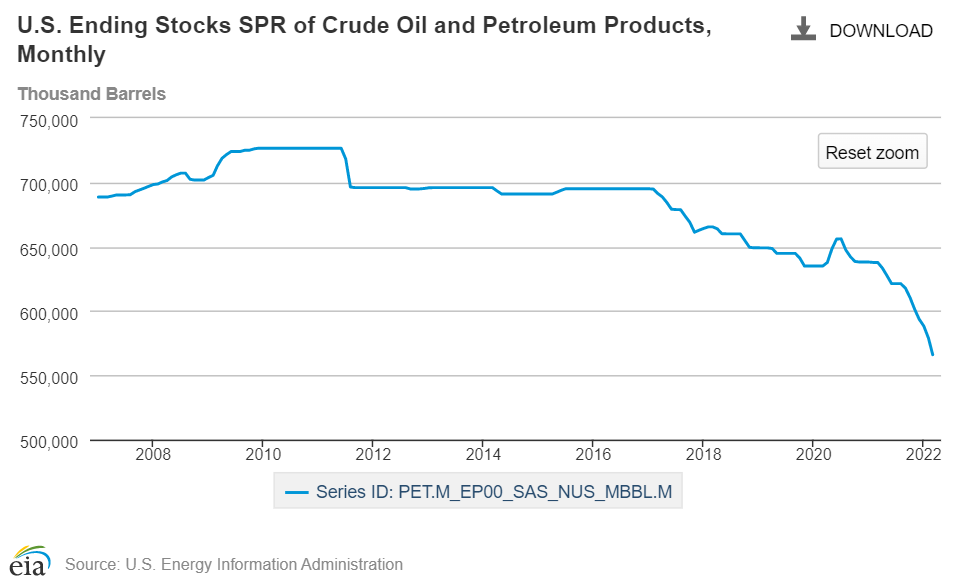
With a recession looking imminent, if we aren’t in one already, inflation is still not slowing down. Crude oil is still trading over $100 a barrel even with the US deploying their strategic reserves, and China in lockdown. However, other parts of the inflation bundle may be slowing. The risk for the US is that they manage to decrease demand enough in their country, only to have China open and increase demand from their end.


With inflation at 8.6%, we should be seeing interest rates at around 8-10% as well. However, with the recent rate hikes, the gap between inflation and interest rates is huge. The last time the gap was this large was back in the 1940-1950s. Interest rates are the main tool by which the Fed tries to control inflation, so when interest rates are this far behind inflation, something is up (or down!).
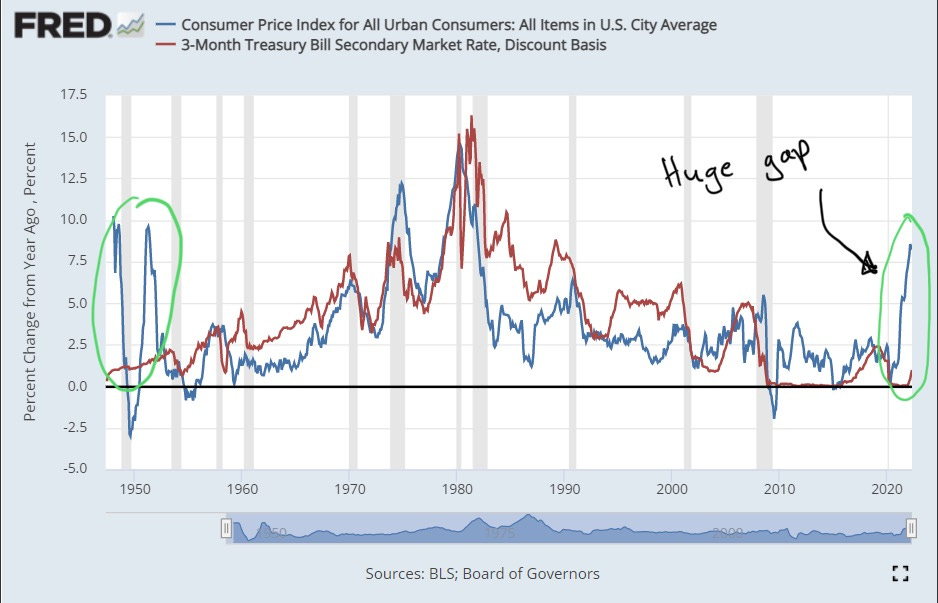
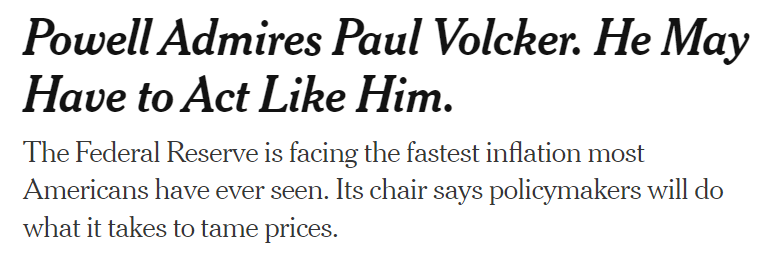
So, what are the similarities between today and the 1940s and how did Paul Volcker (the Fed chair in the 70s) manage to get interest rates up to almost 20% the last time inflation was this high in the 1970s?
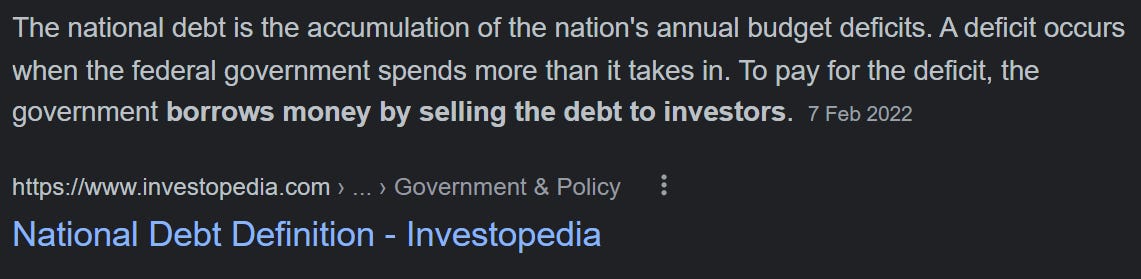
The secret is in the debt as a percentage of GDP. GDP is essentially a countries income, and just like any entity, if your debt becomes too large relative too your income, you are in a spot of bother.
If we overlay Federal Debt/GDP over the last chart, we can see that the late 1940s looks very similar today. Super high debt/GDP along with high inflation and low interest rates. Whereas in the 70s, debt/GDP was around 30% compared to today’s levels of 125%!
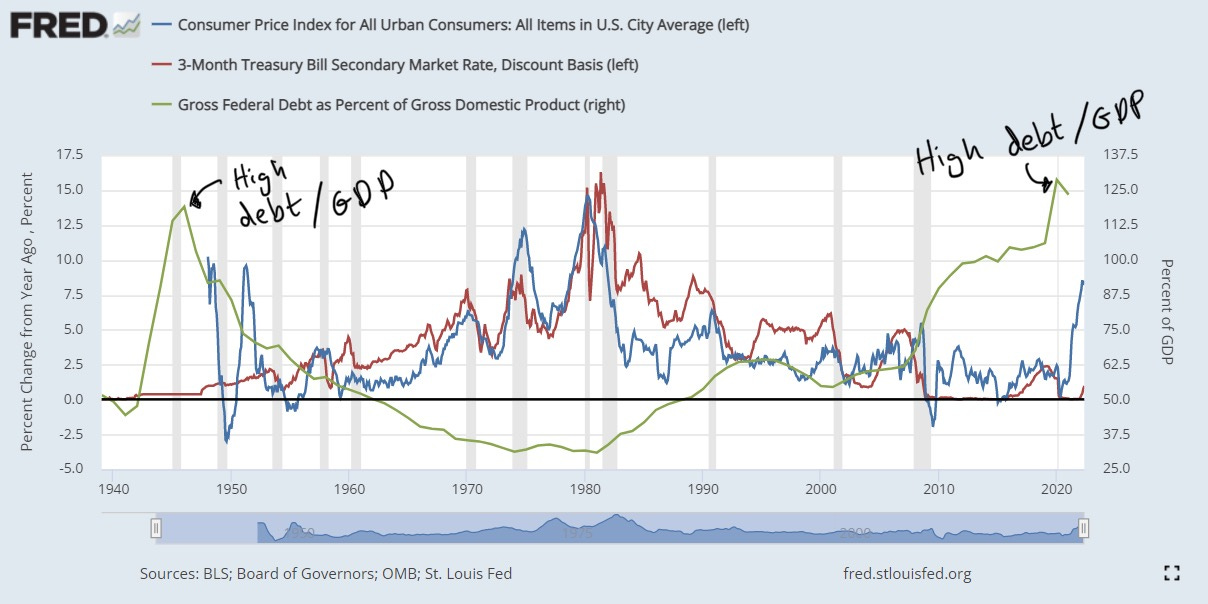
If Jerome Powell were truly channelling his inner Paul Volcker, he would bankrupt the country quite quickly. There is simply too much debt in the system.
To do some quick back of the envelope math:
Current government debt = $30401 billion.
Let’s assume all gov. debt interest rates are at 8%, that would bring annual interest expenses to $2432 billion.
The government gets the majority of its revenue from tax receipts.
Tax receipts over the last year are at a record high of $2849 billion.
$2432/$2849 * 100 = 85%
That means 85% of all the revenue from tax receipts would go toward paying interest payments alone!
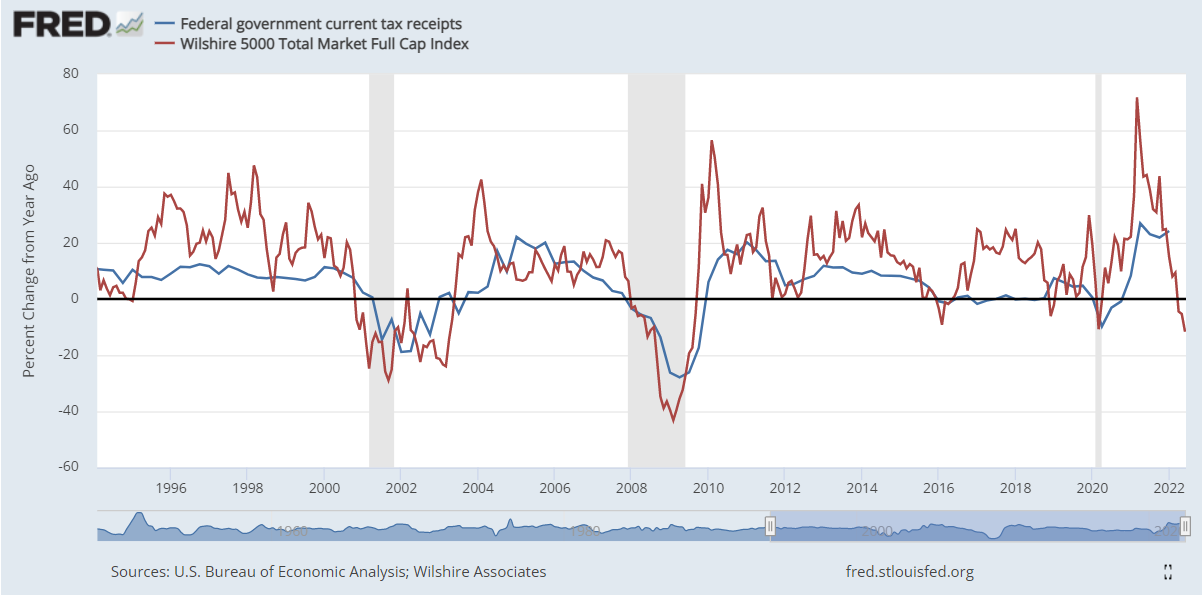
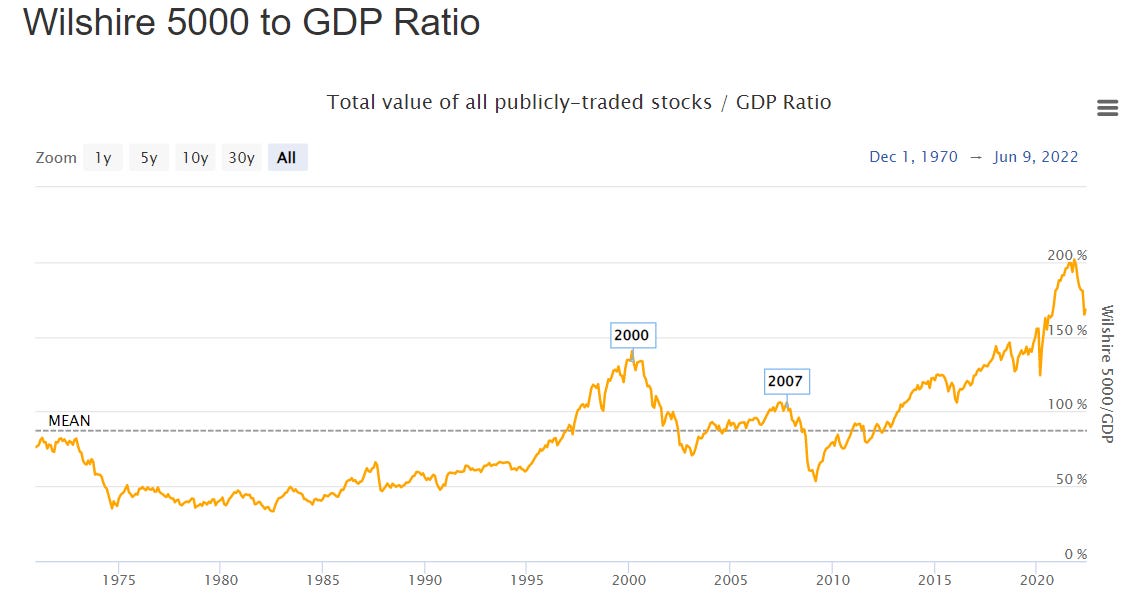
This is astronomical and clearly unrealistic. This is why even with all the hoo ha from the Fed, they still only aim to have interest rates reach 3.5% by the end of the year, with a peak rate of 3.8% in 2024. On top of all this, we have assumed tax receipts will remain at their current record highs. The US stock market is 167% of the entire countries GDP. This is an extremely overly financialised economy, and as such, falling stock prices have more of an impact than just making us all feel a lot poorer. Falling asset prices also lead to falling tax receipts. This puts even more of a strain on the US government to finance their debt.
We can see the relationship between year-over-year changes in stock prices (red) and tax receipts (blue).
So, how the hell does this all play out.
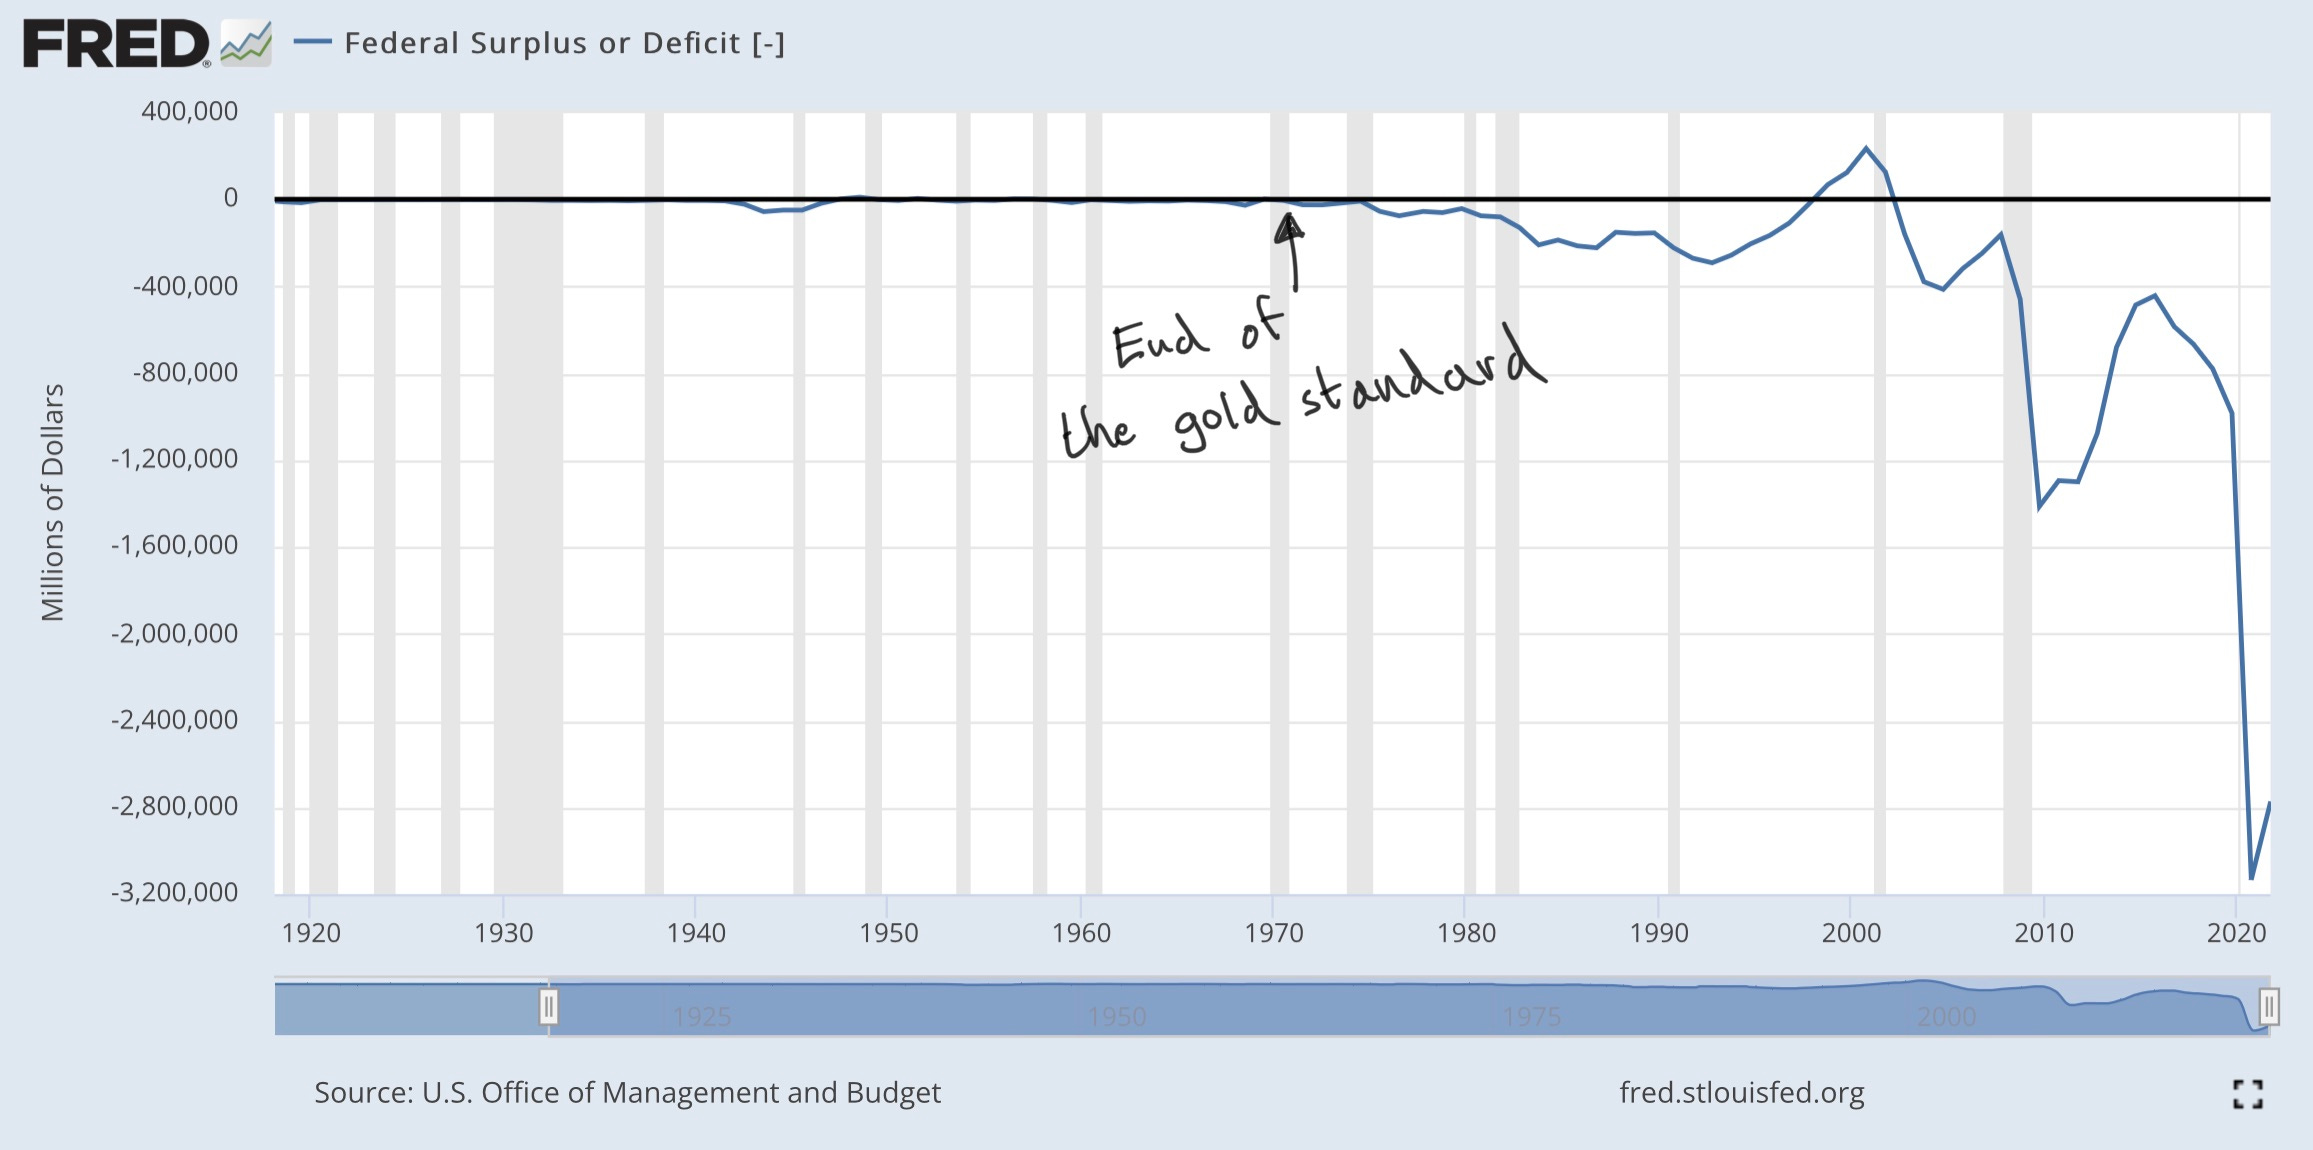
At some point the Fed is going to have to pivot and buy more of the government’s debt. The US government is an extremely unprofitable entity, as you can see from the Federal Deficit below. The only way they can finance this deficit, is through taking on more debt.
Global demand for US debt (treasury bonds) is falling, so at some point the Fed will have to pivot and become a buyer by printing more. However, this is likely not going to happen until inflation rolls over. Even though the Fed can’t raise interest rates to anywhere near current inflation, they can still raise them, and raise them they shall. More pain needs to be felt by the financial markets in order for them to kill demand and try to bring inflation under control. There is also the alternative path, where the Fed may have to pivot with inflation still fairly high. This path could be if we get a recession, but inflation still remains high inflation, or if something starts to break in the bond markets, like in March 2020.
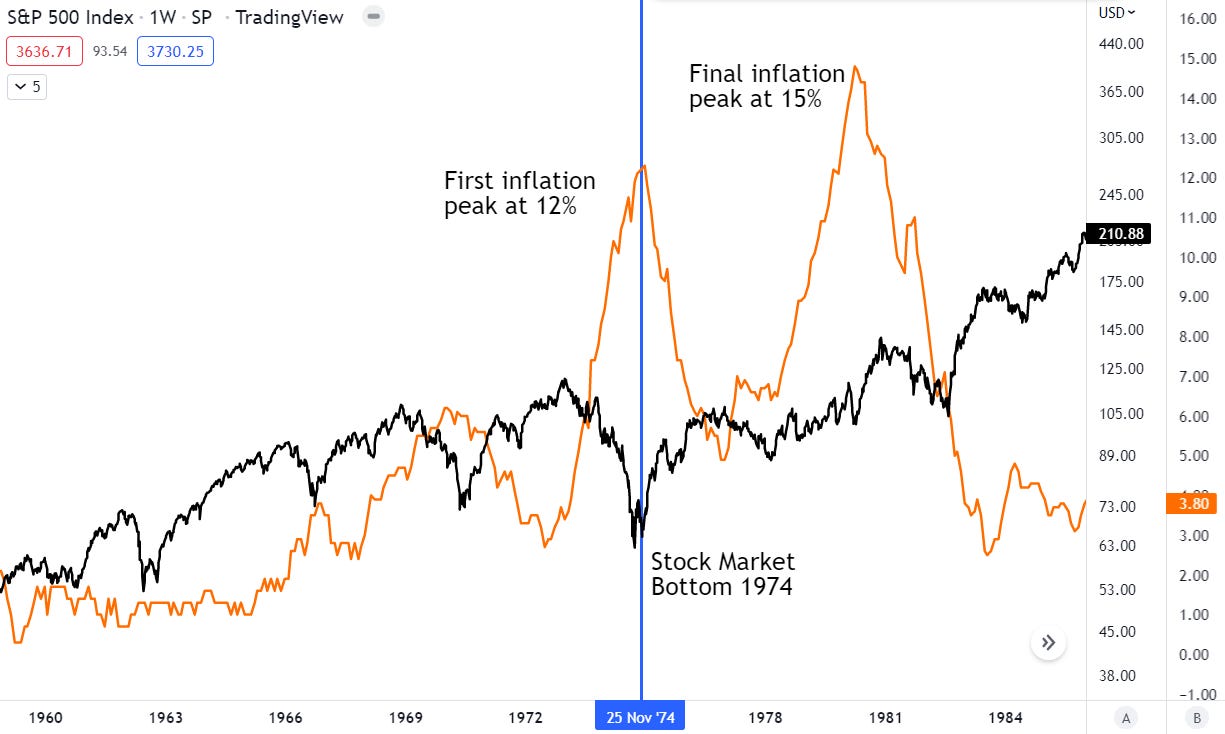
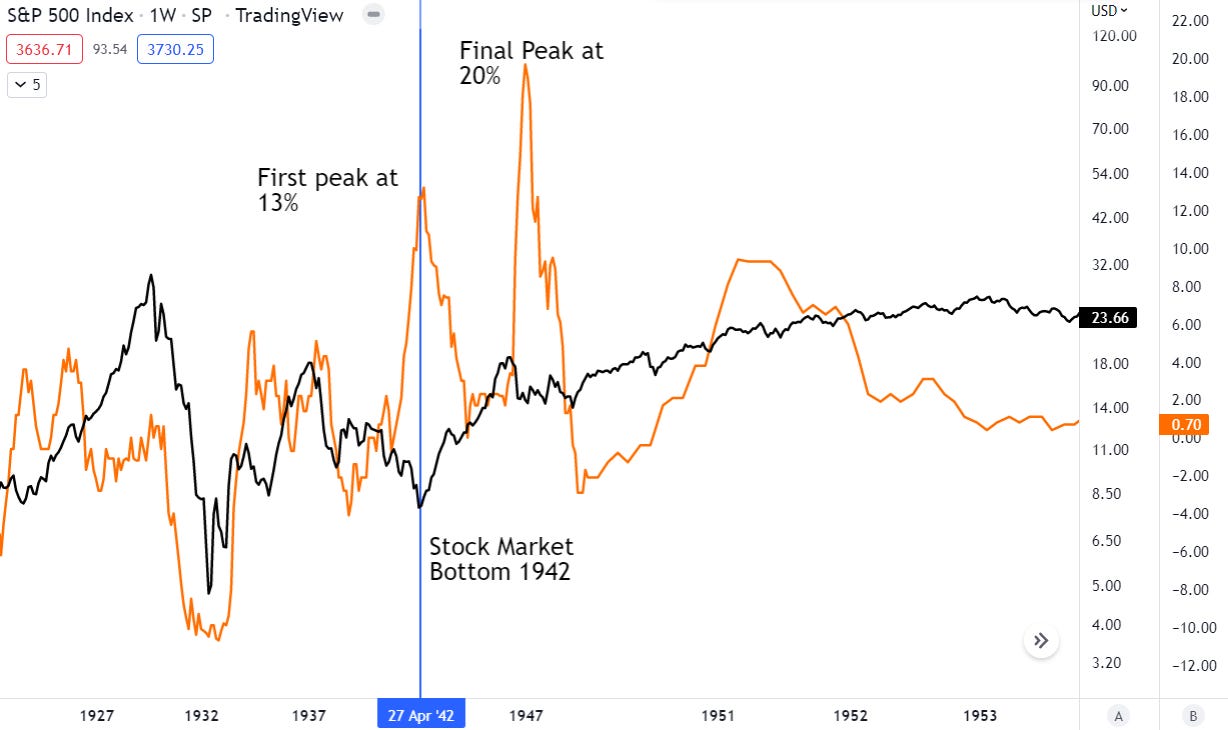
Given this environment, stocks are likely to keep feeling pain. If we look to the past to see when the stock market bottomed in previous inflationary environments, we can see that it was after inflation made its first peak.
Given that Bitcoin and the stock market are highly correlated, it’s hard to call a definitive market bottom until the stock market also bottoms. And we probably won’t see the stock market bottom until inflation rolls over. As we don’t know when exactly that will be, the next best thing we can do is to decide when an asset is undervalued. In their most recent annual meeting, Warren Buffet and Charlie Munger were asked how they have managed to time the market so well. They’re answer was that they never try to time the market and they have no idea what the economy or the stock market is going to do. They simply buy when they think something is cheap and build cash when everything is expensive.
‘We were reasonably good at figuring out when we were getting enough for our money’. Warren Buffet on market timing
What is going on in the world is chaotic to say the least. In the words of Littlefinger, one of the most strategic characters in Game of Thrones:
“Chaos isn't a pit. Chaos is a ladder.” - Littlefinger (Peter Baelish)
Peter Baelish had his flaws, but the lesson I think we can garner from this, is that chaos sets itself up for some huge opportunities (for those who are looking).

Whether you are looking to buy real estate, stocks, or Bitcoin, now is not the time to be fearful, it is the time to start looking for those big opportunities. Warren Buffet splashed out a small $620 million into stocks in Q1 2022, his fastest rate since the 2008 financial crisis, however this is still a small portion of his cash holdings. He is slowly layering in to his positions, so that if things keeping getting worse, he can keep buying more.

Which brings us on to Bitcoin.
Update on the Bottom Indicators
I don’t think we can realistically call a macro bottom until inflation peaks or the Fed pivots from its current tightening policy. However, we can look at a range of indicators to speculate on where a macro bottom could be, and where Bitcoin is undervalued.
In the last newsletter, most indicators looked like they still had more room to go, the first of which was the realised price.
The realised price of a single Bitcoin is the value of the Bitcoin the last time it was sold/bought. The realised price of all Bitcoin is the value of all Bitcoin (including Bitcoin bought years ago) at the price they were last sold at, divided by the total Bitcoin in circulation - the average cost basis of all Bitcoin.
We have now officially fallen below the realised price. I’ve marked all areas where this has occurred in red boxes. The other red line you see below is the BTC market cap divided by the realised value. This essentially just shows the extension both above and below the realised price.
BTC price (blue), Realised Price (orange), Mkt Cap/Realised Value (red)
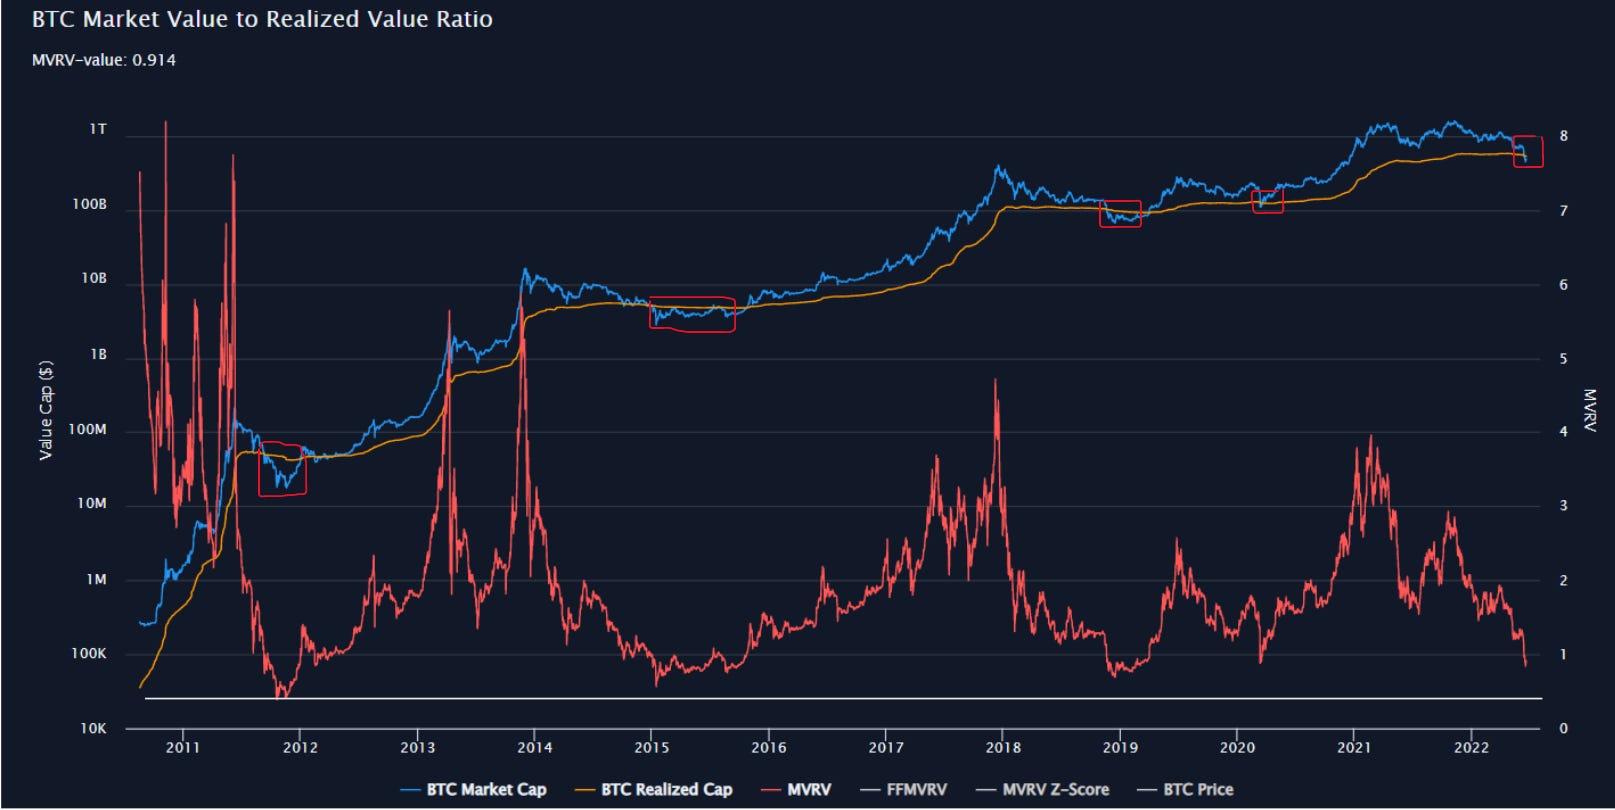
What this tells us is that we are in an area of high value, where Bitcoin has historically bottomed. However, there is still room to fall further, as this indicator has historically been lower.
Next, we have percentage supply in profit and loss. Historical bottoms have occurred after there is a crossover, so that there is in fact more supply in loss than profit.
Supply in loss (red), Supply in profit (orange)
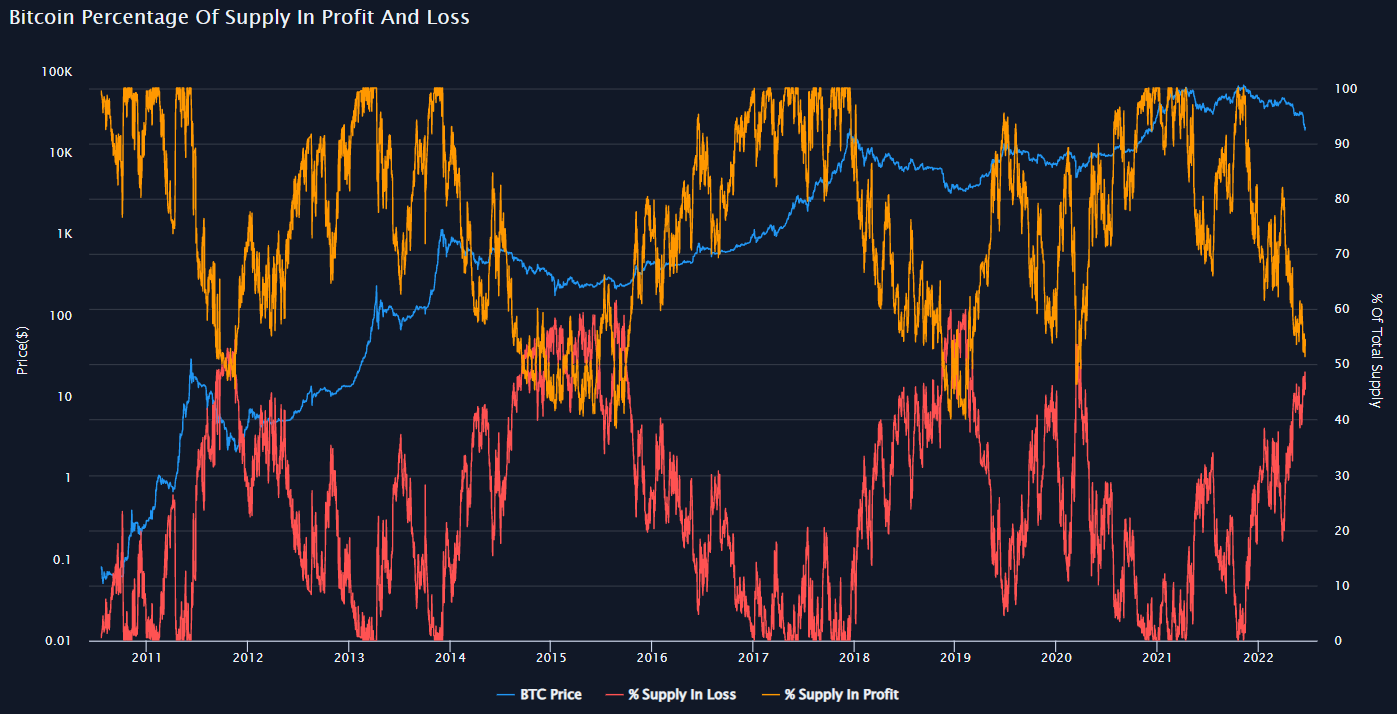
This cross has yet to occur, which indicates the bottom is not quite in yet.
An indicator which is flashing that a bottom is in, is the 200-week moving average.
A moving average captures the average change in a data series over time. The 200-week moving average is simply the average price of the last 200 weeks of Bitcoin price.
200-week MA (Blue), 300-week MA (Purple)
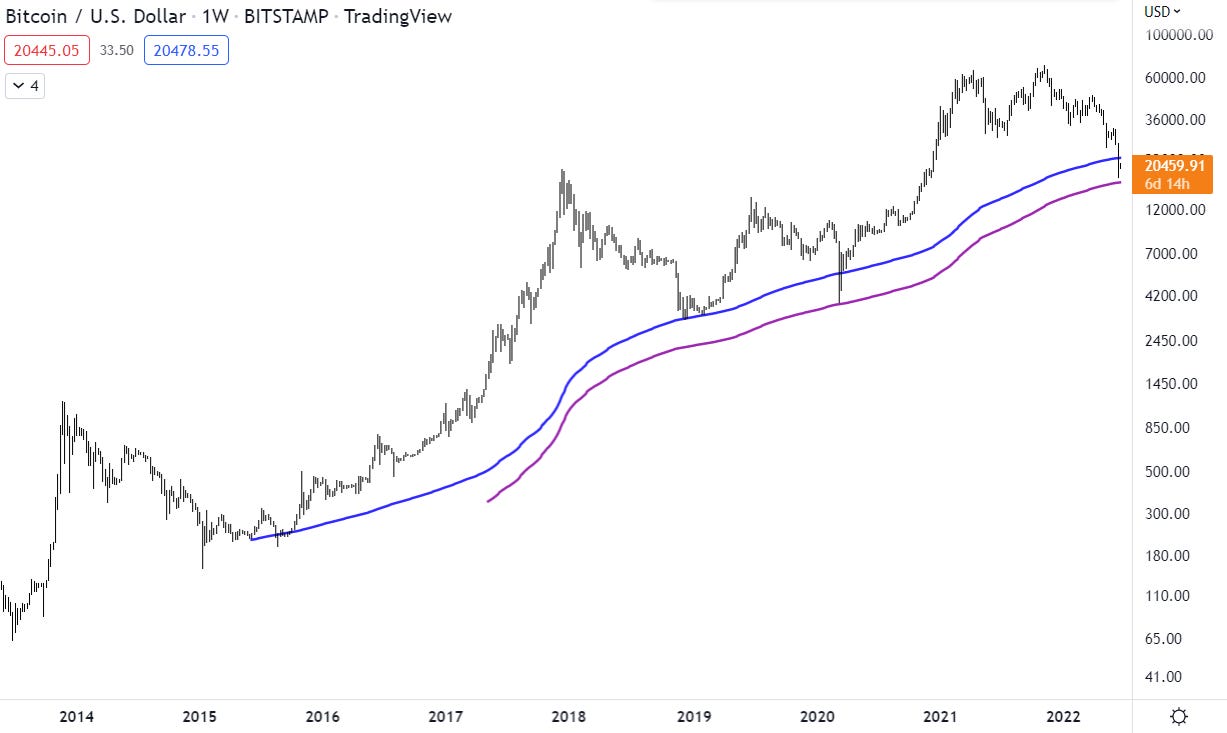
The 200-week has marked historical bottoms, and it has just been breached. I have also overlaid the 300-week as this is where Bitcoin bottomed in March 2020. This indicates we are either at or very near the bottom, but that we could also fall a touch further if we are to reach the 300-week.
The Hash Ribbons, which I won’t go into the details once again, typically flashes very shortly after a bottom has occurred.
Bottom signal (vertical white dotted line)
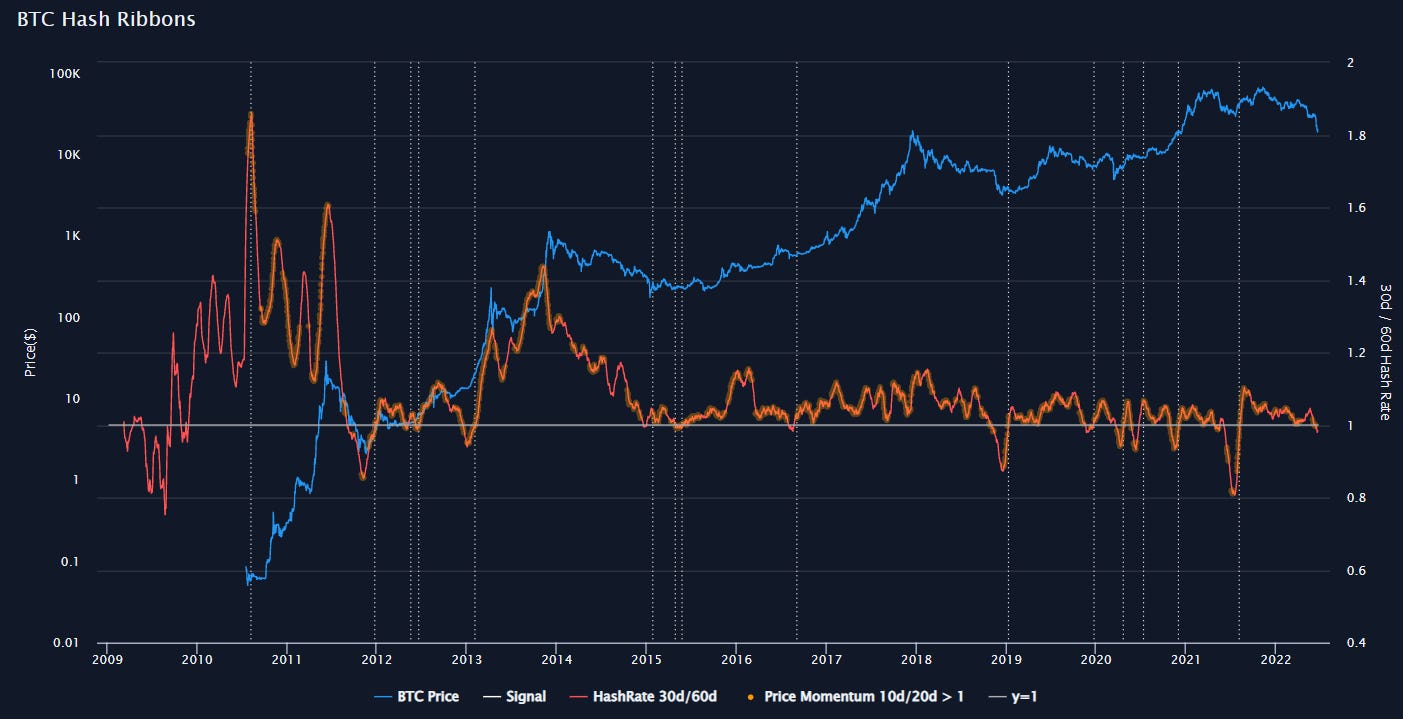
This indicator has flashed at the end of all previous bear markets. But it has yet to flash today.
One indicator which had flashed during the last newsletter was volume. A volume spike following a period of low volume usually marks reversal points pretty well.
Volume in green and red bars below, with dotted green lines to mark spikes.
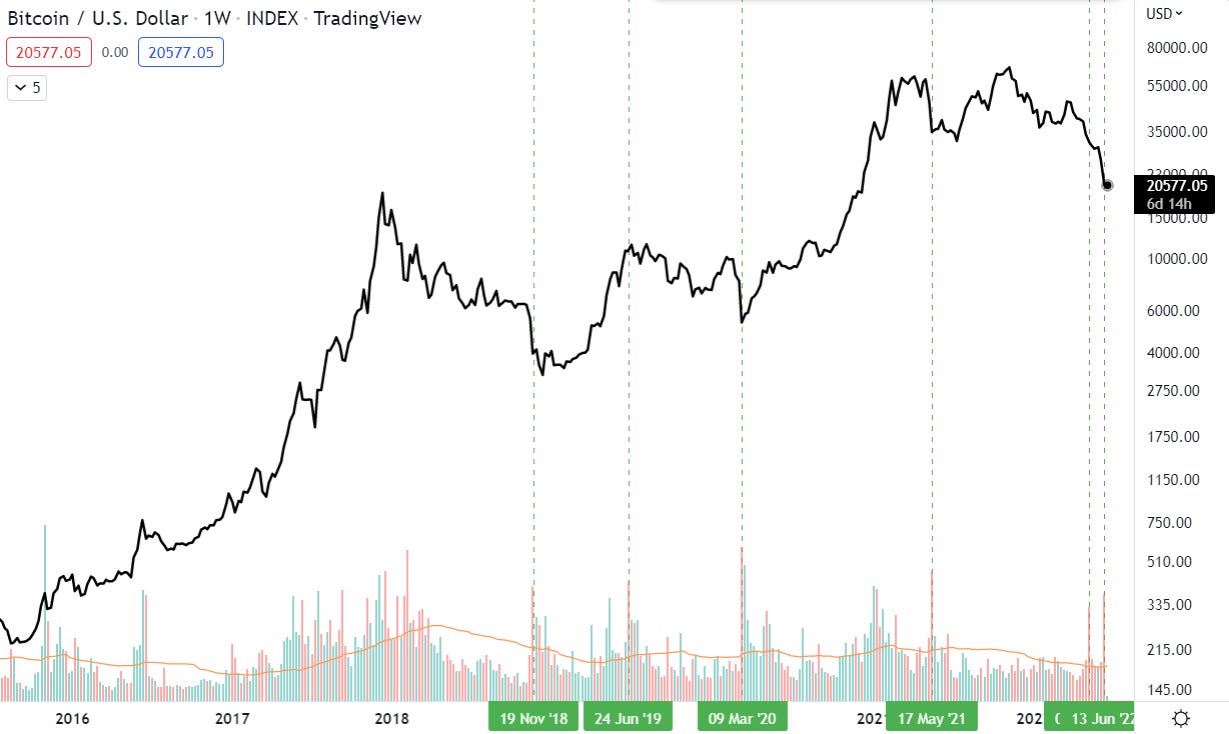
Bitcoin has had another major capitulation with high volume in the most recent leg down. This once again indicates we are either at or very near the Bitcoin bottom.
Something else I want to point out, that I didn’t mention in the last newsletter, are basic support and resistance levels. Bitcoin shot up so quickly in 2021 that it really didn’t leave much structural support behind it. Looking back to 2017, the only clear levels of support are the 2017 high at $20k, a weaker support at $14k, a strong weekly support at around $11k - $12k and of course a huge support at the psychologically significant level at $10k. A drawdown to $10k feels pretty extreme, as it is an 85% drawdown (larger than both previous bear markets), but it helps to just look at these numbers objectively and be open to any possibility.
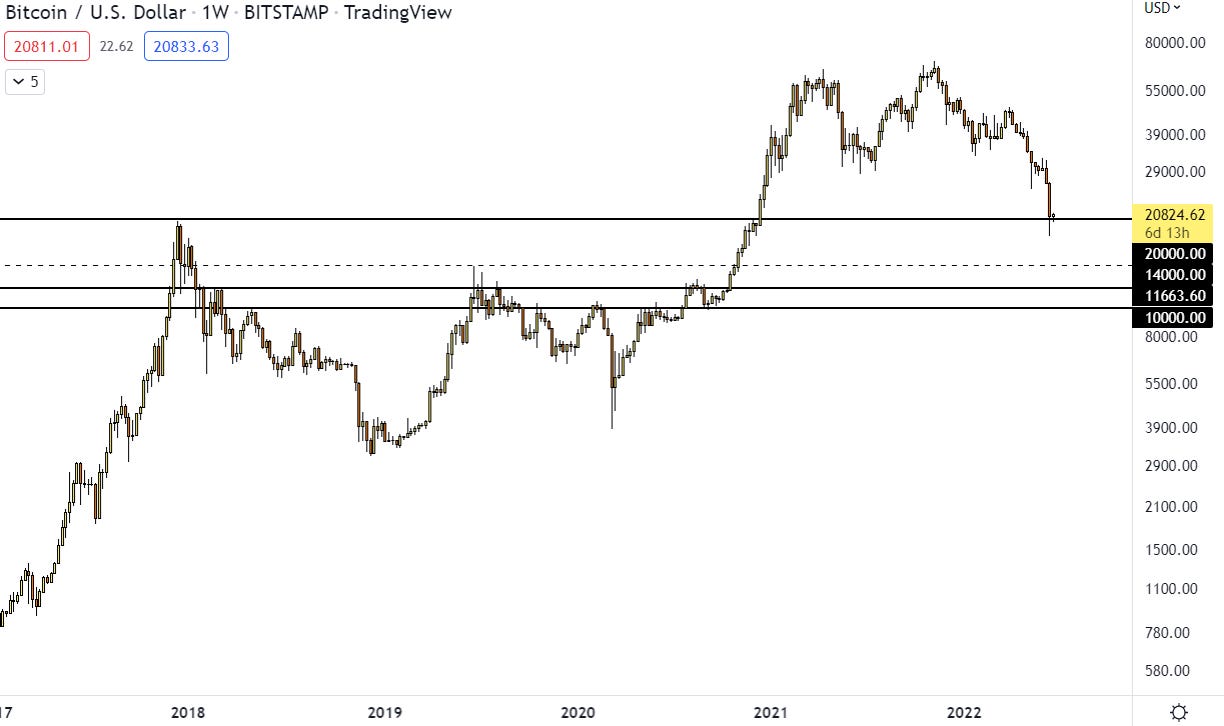
Like the previous indicators, this also tells us that we could be at bottom, as we are at a big support zone, and on the other hand, that there is still room to fall further. This seems to be the tale of the day, and what matter is how we perceive this information and what we decide to do. There is a trap in analysis, in that if you look too hard, you will find evidence to justify everything and anything, and end up knowing no more than you did beforehand.
So, to zoom out somewhat. The macro is messy, and inflation is raging hot, causing the Fed to tighten (raise interest rate + quantitative tightening). This is bringing down almost all financial assets, including Bitcoin. We cannot tell when exactly this tightening will end, but we know it will either be after inflation has peaked, or something starts to break in the economy or bond markets. The outlook over the next 6 months doesn’t look great and the US looks like it may already been in a recession. The markets are forward looking, so they will likely bottom before the economy starts to recover. In all this chaos, we are looking for opportunity. One of those opportunities is Bitcoin. Due to all this macro chaos, and its general cyclical nature, it is historically very cheap. Timing the bottom is a fool’s game, but we can try to get close. Some indicators are saying we are at a bottom, others are yet to flash. The jist of it is that we are close.
One thing to note is that wherever the bottom is, and whenever we bottom, we will likely remain there for some time building out a base, so don’t go aping in all your money now. Have patience, knowing that in time things will become clearer.
Given that the Fed will have to print again someday, and that the financial markets won’t go down forever, my plan here is simple:
Be Bitcoin heavy and avoid altcoins including Ethereum. These will continue to bleed against Bitcoin no matter how much you believe in them. There will likely be a time to buy alts again, but that time is not now. To say you are catching a falling knife is an understatement.
Hold cash for the sake of psychological peace and for optionality in these volatile markets. Its possible things keep getting worse for now and you want to be able to capitalise on any extreme outcomes.
Keep buying Bitcoin in either time increments or price. What I mean by this is that you can choose to buy at 30k, 25k, 20k, 15k etc, or you can choose to simply buy x amount every month. Whatever works for you, I do a bit of both. This way, no matter where the bottom is, you will have bought it.
I also think there are two key principles we should keep in mind in this current environment.
The first is that the market can remain irrational for much longer than you can stay solvent. Don’t invest more than you can you afford to lose. It’s so simple, yet many still ignore it. Secure your personal financial security first. We are heading into a recession, and you should be prepared as such. Minimise debt, don’t spend stupidly, have funds for a rainy day. It is from this base that you can invest your money safely.
The next principle is that nothing stays the same forever. Pretty much everything is cyclical. If things in the world look bad now, they will probably look good again in the future. Don’t get caught in the trap of thinking ‘this time is different’.
I’ll end this section with an extract from the book, ‘The Most Important Thing: Uncommon Sense for the Thoughtful Investor’, by Howard Marks.
“Every once in a while, an up-or-down-leg goes on for a long time and/or to a great extreme and people start to say "this time it's different." They cite the changes in geopolitics, institutions, technology or behaviour that have rendered the "old rules" obsolete. They make investment decisions that extrapolate the recent trend. And then it turns out that the old rules still apply and the cycle resumes. In the end, trees don't grow to the sky, and few things go to zero.”
- Howard Marks

Personal
A collection of random bits and pieces that I have collected over the last month.
How to View Energy and its Importance in Today’s Environment With Putin.

Debunking the Common Myth That Cardio Kills Muscle Growth.


Bitcoin’s Supply/Demand Dynamics with Jurrien Timmer


A New Bitcoin Show with Natalie Brunell!
Quote to Ponder (Ty Tim Ferris)
“Forgiveness is accepting the apology you will never receive.”
- Shawne Duperon
I think that’s all for this week. Stay solvent and see you next time!
Best wishes,
Tats
Library
Bullish - Causing, expecting, or characterized by rising stock market prices.
Bearish - Causing, expecting, or characterized by falling stock market prices.
Bear Trap - Tricking everyone that price is going to break down, before moving up.
Bull Trap - Tricking everyone that price is going to break up, before crashing down.
DCA - Dollar Cost Average. Investing incrementally on fixed schedule.
DEX - Decentralised exchange.
EMA - Exponential moving average
ETF - Exchange traded fund. A type of security that tracks an index, sector, commodity, or other asset, but which can be purchased or sold on a stock exchange the same way a regular stock can.
Fed - The Federal Reserve, central banking system of the US.
Fiat Currency - Fiat money is government-issued currency that is not backed by a physical commodity, such as gold or silver.
FOMC - The Federal Open Market Committee (FOMC) is the monetary policymaking body of the Federal Reserve System.
Fractal - Repeating patterns from the past.
HODL - To hold your coins and not sell them despite crashes in price.
MA - Moving average.
S/R - Support/Resistance level.
Stablecoin - A cryptocurrency pegged to a traditional fiat currency, like the dollar.
Whale - A very large holder of Bitcoin.
The information contained herein is for informational purposes only. Nothing herein shall be construed to be financial legal or tax advice. The content of this email is solely the opinions of the write who is not a licensed financial advisor or registered investment advisor. Trading cryptocurrencies poses considerable risk of loss. The writer does not guarantee any particular outcome.